Get This Data Analysis Presentation And Google Slides

Pack of 17 slides
P.ID : 3906
Advertisement
1.1K+ views
43 Downloads
Get Custom Slides by Experts
Enhance Your Presentations with Add-ins
Google Slides Add-in
Access templates directly in Google Slides
Microsoft PowerPoint Add-in
Access templates directly in PowerPoint
GPT Add-on
AI-powered presentation assistance

Data Analysis PowerPoint, Google Slides, and Canva Template


The Data Analysis presentation template is a modern and professional slide deck designed to transform raw business data into clear, actionable insights. With its clean blue-and-orange theme, dashboard visuals, and chart-focused layouts, it is ideal for presenting analytical reports, business performance reviews, and strategic insights. The design helps communicate complex information in a visually simple and engaging manner.

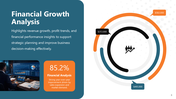
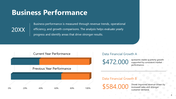
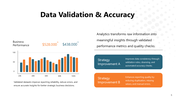
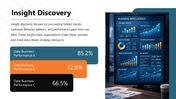
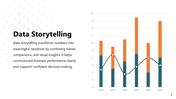
This template includes key sections such as introduction to data analysis, financial growth analysis, business performance, data validation and accuracy, pattern recognition and forecasting, insight discovery, data storytelling, comparison analysis, and conclusion. It is highly suitable for business analysts, data teams, corporate presentations, performance review meetings, and academic reports. The slides are structured to clearly present trends, KPIs, comparisons, forecasts, and business growth metrics.

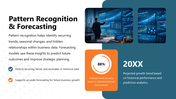
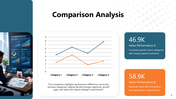
The sections on pattern recognition, forecasting, and comparison analysis are especially useful for showcasing trend identification, predictive insights, and year-over-year performance evaluation. With fully editable charts, graphs, icons, and text placeholders, this template can be easily customized for different industries and reporting needs. Overall, it is an excellent choice for presenting data-driven insights, performance analysis, and strategic business decisions in a professional format.


Features of this template

  • 100% customizable slides and easy to download.
  • The slides contain 16:9 and 4:3 formats.
  • Easy to change the colors quickly.
  • Highly compatible with PowerPoint, Google Slides, and Canva templates.

You May Also Like These PowerPoint Templates

Add to Wishlist
Download
AI Customize
Data cleansing cycle PowerPoint slides with different colorful layout designs with icons and text descriptions.
Add to Wishlist
Download
AI Customize
Illustration of a man holding a laptop with data visualization, alongside three numbered text sections with green arrows.
Add to Wishlist
Download
AI Customize
Data analysis PowerPoint featuring an illustration of data charts and various slides layouts for analysis steps.
Add to Wishlist
Download
AI Customize
Data analysis template featuring a magnifying glass graphic, numbered sections, and placeholder blocks.
Free
Add to Wishlist
Download
AI Customize
Data analysis template with two circular progress charts displaying 70% and 45% and six labeled captions with text area.
Add to Wishlist
Download
AI Customize
Informative slides about data science, highlighting colorful different layout designs and icons.
Add to Wishlist
Download
AI Customize
Circular data science application slide with ten numbered colorful boxes, arranged in a ring around a central title.
Free
Add to Wishlist
Download
AI Customize
Colorful circular layout with grey central circle with icon, surrounding seven nodes, illustrating data cleansing steps.
Free
Add to Wishlist
Download
AI Customize
Visual representation of data classification, featuring a laptop and labeled categories on a purple background.
Add to Wishlist
Download
AI Customize
Horizontal bar chart displaying data for five months and six regions, with four labeled icons in blue, purple, red, and teal.
Add to Wishlist
Download
AI Customize
Data analytics slide featuring laptops, tablets, charts, and graphs, with four options and icons listed below.
Add to Wishlist
Download
AI Customize
Hexagonal Flowchart of data science applications in social media, highlighting from recommendation engine upto optimization.
Add to Wishlist
Download
AI Customize
A 3D smartphone graphic showing data lines and charts, with white text on the left, set against a blue backdrop.
Add to Wishlist
Download
AI Customize
Support model diagram with six colorful triangles with icons showing data driven, cost efficient, and flexible strategies.
Add to Wishlist
Download
AI Customize
Data science benefits visualized in a four step process with numbered colorful tabs in pink, green, orange, and blue.
Add to Wishlist
Download
AI Customize
Collection of data analytics icons, including charts, browser windows, magnifying glasses, and statistical graphs.
Add to Wishlist
Download
AI Customize
Editable Data Mining Essentials PPT And Google Slides
Add to Wishlist
Download
AI Customize
A pack of qualitative research method slides showcasing various colorful layout designs and icons.
Add to Wishlist
Download
AI Customize
Data analytics slide with six labeled captions, each featuring a colored status indicator in green, orange, or red.
Add to Wishlist
Download
AI Customize
Five colored diamond shapes representing data cleansing strategies, such as automated validation and error detection.
Add to Wishlist
Download
AI Customize
A data science slide with four colorful arrows labeled, from one to four each containing text and small descriptive icons.
Add to Wishlist
Download
AI Customize
Data quality management slides with different colorful layout designs and text descriptions.
Add to Wishlist
Download
AI Customize
Awesome Data Cleansing Structure PPT And Google Slides
Add to Wishlist
Download
AI Customize
Slide showing a metrics table on the left and a bar chart with orange and white bars on a blue gradient background.
Add to Wishlist
Download
AI Customize
Circular diagram with six colored segments around a central circle, illustrating the steps of data analysis.