Data Analysis And Business Insights PowerPoint Templates

Pack of 17 slides
P.ID : 10541
Advertisement
727 views
65 Downloads
Get Custom Slides by Experts
Enhance Your Presentations with Add-ins
Google Slides Add-in
Access templates directly in Google Slides
Microsoft PowerPoint Add-in
Access templates directly in PowerPoint
GPT Add-on
AI-powered presentation assistance

Data Analysis PowerPoint, Google Slides, and Canva Template


Data Analysis and Business Insights PowerPoint Template is a comprehensive, professionally designed presentation solution developed for analysts, business strategists, and organizational decision-makers who require a structured and authoritative framework for communicating data-driven findings.

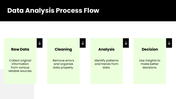
This data analysis template provides a complete analytical narrative — beginning with a formal introduction to data analytics and progressing through a clearly defined four-stage process: data collection, data cleaning, analysis, and decision-making. Each stage is presented with precision, ensuring that both technical professionals and executive stakeholders can follow the methodology with ease.

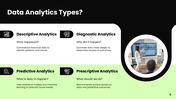
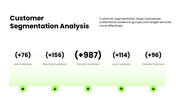
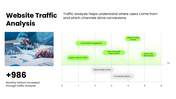
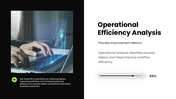
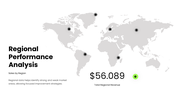
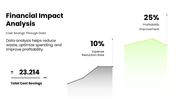
The deck includes dedicated slides addressing four core analytics disciplines — Descriptive, Diagnostic, Predictive, and Prescriptive Analytics — presented in a format that supports informed discussion across departments and leadership levels. Supplementary slides cover key business intelligence areas including Customer Segmentation, Website Traffic Analysis, Operational Efficiency, Regional Performance, and Financial Impact Analysis, enabling organizations to present a thorough, end-to-end view of their data landscape.

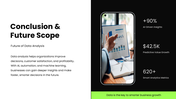
The presentation concludes with a forward-oriented overview of emerging trends in AI, automation, and machine learning, positioning the organization as a forward-thinking enterprise prepared for the next generation of data-driven decision-making.

All slides are fully editable, allowing for seamless customization of text, charts, icons, and layout elements to align with organizational branding and reporting requirements. The template is compatible with Microsoft PowerPoint, Google Slides, and Canva, and is available in both 16:9 and 4:3 aspect ratios.


This template is designed to uphold the standards of professional reporting while ensuring that complex data insights are communicated with clarity, structure, and measurable impact.


Features of this template

  • 100% customizable slides and easy to download.
  • The slides contain 16:9 and 4:3 formats.
  • Easy to change the colors quickly.
  • Highly compatible with PowerPoint, Google Slides, and Canva templates.

You May Also Like These PowerPoint Templates

Free
Add to Wishlist
Download
AI Customize
Data analysis slide with a business figure illustration and bar chart, featuring four colorful captions on a dark backdrop.
Add to Wishlist
Download
AI Customize
Slides featuring an overview of data aggregation processes with numbered steps in different colorful layout designs.
Free
Add to Wishlist
Download
AI Customize
Six hexagons in different colors encircling a central data icon, each labeled with numbers and captions.
Add to Wishlist
Download
AI Customize
A PowerPoint template outlining the responsibilities of a data scientist, featuring four key tasks in a diamond layout.
Add to Wishlist
Download
AI Customize
Three bar charts in red, blue, and green, with captions and text below each for data analysis insights.
Add to Wishlist
Download
AI Customize
Data analytics slide with project progress bars from November to February, showing percentages for each month.
Add to Wishlist
Download
AI Customize
Applications of Data Science in retail marketing, including recommendation systems to inventory management with text.
Add to Wishlist
Download
AI Customize
Comparison slide with a green and blue area graph and demographic data with icons and percentage on the right.
Add to Wishlist
Download
AI Customize
Four hexagons in blue, teal, pink, and balck, each with icons and linked to a gray text box.
Add to Wishlist
Download
AI Customize
A structured chart of green bars, light and dark shades alternating, over a blue lined background with descriptive labels.
Add to Wishlist
Download
AI Customize
Line chart in green, red, and yellow with three product data columns paired with circular percentage boxes and text segments.
Add to Wishlist
Download
AI Customize
Data analytics template with a central magnifying glass and surrounding icons place with caption areas.
Add to Wishlist
Download
AI Customize
Illustration of a person interacting with blue data visualization panels, with three numbered text sections on the right.
Add to Wishlist
Download
AI Customize
Illustration of essential data analytics elements in a visually connected with caption areas circular layout.
Add to Wishlist
Download
AI Customize
PowerPoint slide showing a bar chart with four sections with color coded bars and placeholder text.
Free
Add to Wishlist
Download
AI Customize
Stunning Data Analysis PowerPoint Templates-Four Node
Add to Wishlist
Download
AI Customize
Data analytics PowerPoint template featuring two sections with blue icons for web data and chart analysis.
Add to Wishlist
Download
AI Customize
An infographic slide illustrating the skills and responsibilities of a data scientist in a colorful circular model.
Add to Wishlist
Download
AI Customize
Data analytics slide showing month wise vertical bars in varied colors, with July emphasized as top performing.
Add to Wishlist
Download
AI Customize
Business data analysis graphic with target and arrows in center, surrounded by six colored captions with icons on both sides.
Add to Wishlist
Download
AI Customize
Four colored diamond shapes with curved arrows in the center, surrounded by captions and percentage circles.
Add to Wishlist
Download
AI Customize
Central magnifying glass with a green graph, surrounded by six data related icons arranged circularly.
Add to Wishlist
Download
AI Customize
Data analytics template featuring a central magnifying glass and six surrounding icons and caption areas.
Add to Wishlist
Download
AI Customize
Two caption data analysis slide with text on a dark background and a segmented circular chart with icon on the right.
Add to Wishlist
Download
AI Customize
Data cleansing with circular infographic of eight colored steps around a central icon, plus strategy and process slides.
Add to Wishlist
Download
AI Customize
Data migration slide set with process diagram, flowcharts, timeline steps, database icons, and hexagonal stage breakdowns.
Add to Wishlist
Download
AI Customize
Slide deck showing data valuation methods, using colorful arrows, text boxes, and icons in a clean and modern layout.
Add to Wishlist
Download
AI Customize
Data scientist roles and responsibilities slide deck with  numbered infographics across seven layouts showing key tasks.