Colorful Circle Infographic PowerPoint And Google Slides

Creative infographic slide with a six-node design, structured around a central hub, visually linking each numbered step.
P.ID : 23018
    55 views
    8 Downloads
    Get Custom Slides by Experts
    Instantly Access Templates in PowerPoint

    Best Infographic PowerPoint Template


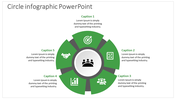
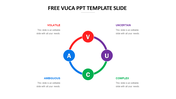
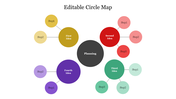
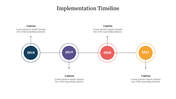
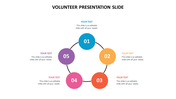
    Reveal the vibrant essence of the Circle Infographics Diagram an aesthetically pleasing tool effortlessly conveying intricate concepts. With seamlessly intertwined circle shapes, this template ensures a cohesive and visually appealing narrative. Tailored for professionals and educators, the fully editable slides, featuring a Multicolor theme with 6 nodes, provide adaptability. Create impactful presentations, simplify information, and captivate your audience with this versatile template. Whether you're a statistic-presenting marketer or an educator unraveling complex topics, this template caters to diverse needs, transforming ideas into visually compelling stories. Embrace the Circle Infographics' influence to leave a lasting impression, presenting a unique and customizable tool for your template.

    Features of this template


    • 100% customizable slides and easy to download.
    • This templates has multicolor.
    • The slide contained 16:9 and 4:3 formats.
    • Easy to change the slide colors quickly.
    • It is a well-crafted template with an instant download facility.
    Advertisement

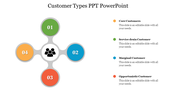
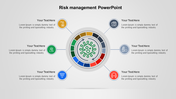
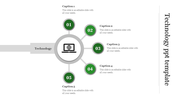
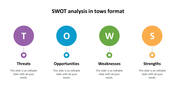
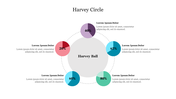
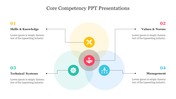
    You May Also Like These PowerPoint Templates

    Add to Wishlist
    Download
    AI Customize
    A PowerPoint slide featuring three concentric circles in yellow, red, and turquoise, with captions below each circle.
    Free
    Add to Wishlist
    Download
    AI Customize
    SWOT analysis slide using an orange wavy design to connect the four sections from strength to threat.
    Free
    Add to Wishlist
    Download
    AI Customize
    Colorful circle infographic in a gear shape for PowerPoint, illustrating five steps with icons.
    Add to Wishlist
    Download
    AI Customize
    Colorful circular organizational chart slide showing a central hub connected to eight divisions with captions.
    Free
    Add to Wishlist
    Download
    AI Customize
    A central hexagon in multi colour with six connected sections representing key information technology components.
    Free
    Add to Wishlist
    Download
    AI Customize
    Horizontal project timeline with five red circular markers and icons representing each year from 2016 to 2020.
    Free
    Add to Wishlist
    Download
    AI Customize
    Red circular infographic with six connected nodes, and white text areas extending outward on a gray background.
    Add to Wishlist
    Download
    AI Customize
    Infographic PowerPoint slide featuring three sections Work, Growth, and Target, each with icons and text sections.
    Add to Wishlist
    Download
    AI Customize
    Four white plates with orange fruit illustrations in circular borders, with captions below.
    Add to Wishlist
    Download
    AI Customize
    Timeline diagram showcasing milestones from 2019 to 2023 with labels and purple highlights connected by dashed lines.
    Add to Wishlist
    Download
    AI Customize
    Four interconnected colorful rings in red, blue, black, and yellow with icons, surrounded by text on a white background.
    Add to Wishlist
    Download
    AI Customize
    Central teal circle connected to four colored circular icons in green, blue, purple, and red, on a light gray background.
    Add to Wishlist
    Download
    AI Customize
    Best slide with a central icon connected to three color coded icons representing analytics, target, and settings with text.
    Add to Wishlist
    Download
    AI Customize
    Four colorful arrow shapes in yellow, blue, purple, and orange, each containing a letter and text below.
    Add to Wishlist
    Download
    AI Customize
    Horizontal layout with arrows linking pink numbered circles and gray icons, around a larger circular description node.
    Add to Wishlist
    Download
    AI Customize
    Diagram illustrating the five steps of stakeholder management, from identify to communicate, with icons representation.
    Add to Wishlist
    Download
    AI Customize
    Colorful circular sales and marketing plan slide with segments from SEO to sales touch with icons and placeholder text.
    Add to Wishlist
    Download
    AI Customize
    Red circular SWOT analysis design with icons in each quadrant representing strength, weakness, opportunity, and threat.
    Add to Wishlist
    Download
    AI Customize
    Yoga PowerPoint slide featuring four circular icons representing yoga poses with captions for detailed descriptions.
    Add to Wishlist
    Download
    AI Customize
    Seven interconnected circles in blue, green, and orange with icons, each linked to captions on a white background.