Get Affordable Cost Gap Analysis Template Themes Design

Effective Cost Gap Analysis PowerPoint Templates
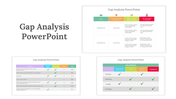
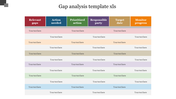
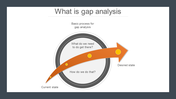
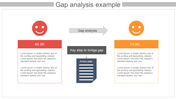
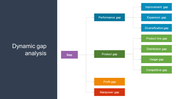
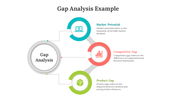
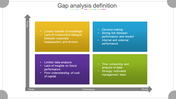
A gap analysis is companies' method to compare their current performance with their wanted, expected performance. This template will help you present important information about cost Gap Analysis. The icons on the slide will help the audience to get an idea about your core content. You can include text, color in your PPT to make it look nice. Users can use this template in financial meetings or business meetings.
About this template:
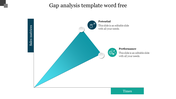
It is a multicolored template with a multicolored graph. The graph helps you to present an essential comparison to the audience. This template is easily understandable by people who are new to your project. However, users can add more data to caption and compare two types of data. This slide has two areas with a creative caption and multiple nodes. In addition, We also have a wide range of Gap analysis PowerPoint slides.
Benefits you get from this template:
- This template is 100% editable and free to download.
- For example, you can change the icon colors in this PowerPoint slide.
- This template reports in less time so that viewers understand its purpose.
- In addition, the template helps to show the comparison data.
Feature of this template:
- Fully Customizable (shape color, size & text)
- This template has a Multicolor theme, and you can also choose the color
- Huge Collections of slides to impress your audience
- It supports an aspect ratio of 16:9 and 4:3 format
- Easy to change the slide colors quickly.


You May Also Like These PowerPoint Templates
Add to Wishlist
Download
AI Customize

Add to Wishlist
Download
AI Customize

Add to Wishlist
Download
AI Customize

Add to Wishlist
Download
AI Customize

Add to Wishlist
Download
AI Customize

Add to Wishlist
Download
AI Customize

Add to Wishlist
Download
AI Customize

Add to Wishlist
Download
AI Customize

Add to Wishlist
Download
AI Customize

Free
Add to Wishlist
Download
AI Customize

Add to Wishlist
Download
AI Customize

Add to Wishlist
Download
AI Customize

Add to Wishlist
Download
AI Customize

Add to Wishlist
Download
AI Customize

Add to Wishlist
Download
AI Customize

Add to Wishlist
Download
AI Customize

Add to Wishlist
Download
AI Customize

Add to Wishlist
Download
AI Customize

Add to Wishlist
Download
AI Customize

Add to Wishlist
Download
AI Customize
