Impressive Cluster Diagram Template PPT and Google Slides

Four step grey timeline with circular nodes and icons, arranged chronologically from 2017 to 2020 placed in white background.
P.ID : 29318
    133 views
    8 Downloads
    Get Custom Slides by Experts
    Enhance Your Presentations with Add-ins
    Google Slides Add-in
    Access templates directly in Google Slides
    Microsoft PowerPoint Add-in
    Access templates directly in PowerPoint
    GPT Add-on
    AI-powered presentation assistance

    Cluster Diagram Template


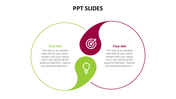
    Promote your presentations and attract your audience by introducing our innovative Cluster Diagram Template. It helps to enhance your presentations with organizational efficiency. The slide comes with a central circle surrounded by a cluster of circles. It symbolizes interconnectedness and collaboration. Three icons represent creativity and networking. 

    Suitable for a project manager visualizing team dynamics, a marketer illustrating network structures or a strategist mapping out creative collaborations. Ideal for professionals across various fields such as business, marketing, design and education. Download today to add detailed explanations and insights into the relationships and connections depicted within the cluster. 

    Features of the template

    • The slide contains 16:9 and 4:3 formats.
    • Compatible with Google slide themes and PowerPoint.
    • 100% customizable slides and easy to download.
    • It is easy to change the colors of the slide quickly.
    • Well-crafted template with an instant download facility.
    Advertisement

    You May Also Like These PowerPoint Templates

    Add to Wishlist
    Download
    AI Customize
    Isometric path with five vertical colored pillars in purple, blue, red, green, and orange, and placeholder text.
    Add to Wishlist
    Download
    AI Customize
    Isometric PowerPoint slide with a timeline and icons representing different steps or stages.
    Add to Wishlist
    Download
    AI Customize
    Illustration of an orange globe held by a hand, connected to green circular icons with dotted lines and three captions.
    Add to Wishlist
    Download
    AI Customize
    Illustration of network connectivity featuring spheres connected by lines and a symbolic figure with gears in its head.
    Add to Wishlist
    Download
    AI Customize
    Professional Cloud Networking PPT Presentation For You
    Add to Wishlist
    Download
    AI Customize
    Cluster Diagram Template — Edit and Present
    Add to Wishlist
    Download
    AI Customize
    Central brown cluster with four numbered circles in yellow, green, red, and blue, each connected to three smaller icons.
    Add to Wishlist
    Download
    AI Customize
    Three branch cluster model in orange, green, and yellow, extending from a central circle, connected to smaller nodes.
    Add to Wishlist
    Download
    AI Customize
    Innovative Cluster Infographic PowerPoint PPT
    Add to Wishlist
    Download
    AI Customize
    Cluster model slide with a central node connected to three branches, each labeled with captions and orange circular icons.
    Add to Wishlist
    Download
    AI Customize
    Cluster model diagram with central node connected to three main branches with icons and captions.
    Add to Wishlist
    Download
    AI Customize
    3D cluster diagram with interconnected gray and purple spheres forming a network structure, with six captions on both sides.
    Add to Wishlist
    Download
    AI Customize
    A cluster diagram slide with a central node title cluster model and three connected nodes, each with captions.
    Add to Wishlist
    Download
    AI Customize
    Clustering diagram with six hexagons connected to a central caption hexagon, labeled with icons, headings, and numbers.
    Add to Wishlist
    Download
    AI Customize
    Slide featuring a red and white cluster diagram, illustrating three key concepts linked to a central model.
    Add to Wishlist
    Download
    AI Customize
    Cluster diagram with a central person icon, surrounded by four labeled clusters each with connected percentage indicators.