Annual Presentation PPT template and Google slides

Stacked bar chart showing monthly data with red, green, and blue segments, labeled January to December.
P.ID : 8394
    481 views
    36 Downloads
    Get Custom Slides by Experts
    Instantly Access Templates in PowerPoint

    Clean Annual Presentation PPT template


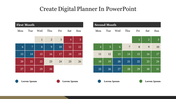
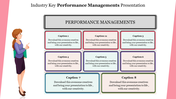
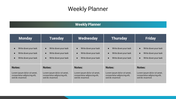
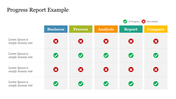
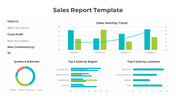
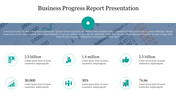
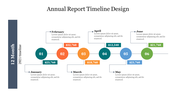
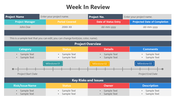
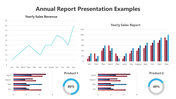
    Struggling to make your annual report presentation visually engaging? This annual presentation PPT template is your secret weapon! It features a clear graph and a large text area to help you showcase your year's performance in a way that's both informative and eye-catching. Imagine using the graph to show trends, growth, or important numbers, and the text area to explain what it all means. With a clean design and a focus on clarity, this template keeps your audience engaged and informed. Perfect for business professionals, teachers, or anyone presenting their annual results, this template makes explaining your year's journey a breeze. Download today and transform your annual presentation into a captivating story of your achievements

    Features of the template


    • 100% customizable slides and easy to download.
    • The slides contain 16:9 and 4:3 formats.
    • Easy to change the colors quickly.
    • It is a well-crafted template with an instant download facility.
    • It is a 100% pre-designed slide.
    • The slide holds vibrant colors.
    Advertisement

    You May Also Like These PowerPoint Templates

    Add to Wishlist
    Download
    AI Customize
    Annual report slide with a colorful chart representing yearly industry expenses, totaling 300K across various categories.
    Add to Wishlist
    Download
    AI Customize
    Finance report slide displaying a table of expenses, net income, and profit from 2013 to 2019, with a bar chart below.
    Free
    Add to Wishlist
    Download
    AI Customize
    Graphic displaying annual report sheets, a colorful bar chart, green blocks and a pink magnifying glass.
    Add to Wishlist
    Download
    AI Customize
    A monthly PowerPoint template displaying colorful wave like graphs for each month from January to June with placeholder text.
    Free
    Add to Wishlist
    Download
    AI Customize
    Slide with a colorful circular chart divided into orange, green, red, and blue segments, centered with a black bar chart.
    Add to Wishlist
    Download
    AI Customize
    Horizontal table with metric labels in colorful blocks on the left and status bars with descriptions on the right.
    Add to Wishlist
    Download
    AI Customize
    Effective Business Report Sample PPT Presentation Slide
    Add to Wishlist
    Download
    AI Customize
    Quarterly report slide with a vertical red arrow marking Q1 to Q4 in colorful circles and text rows on a teal background.
    Add to Wishlist
    Download
    AI Customize
    Six-step supply chain process with hexagonal segments connected by a timeline, from raw materials to purchase.
    Free
    Add to Wishlist
    Download
    AI Customize
    Circular green chart at the center divided into segments, with four rectangular text boxes, on a white background.
    Add to Wishlist
    Download
    AI Customize
    Project status report template with a timeline graph from 2016 to 2025 and colored bars indicating monthly progress.
    Add to Wishlist
    Download
    AI Customize
    Medical icons arranged in square buttons on the left, with case report bullet points on the right in a green background.
    Add to Wishlist
    Download
    AI Customize
    Organized weekly planner with days listed in blue tabs and an illustration of two people planning.
    Add to Wishlist
    Download
    AI Customize
    Annual report slide featuring a financial summary with categories, budget, expenses, and net earnings in a table format.
    Add to Wishlist
    Download
    AI Customize
    Survey results show percentage breakdowns for categories with corresponding figures and brief descriptions.
    Add to Wishlist
    Download
    AI Customize
    Annual report template featuring financial metrics, performance comparisons, and graphical data visualizations.