Attractive Timeline Chart PowerPoint And Google Slides

Innovative Timeline Chart PowerPoint Template
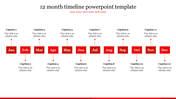
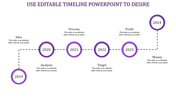
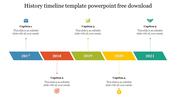
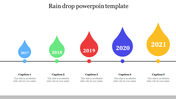
A timeline chart is a visual representation that displays chronological events or activities over a specified period, facilitating the organization and understanding of time-based data. Professionals such as project managers, historians, educators, and researchers often use timeline charts to illustrate the sequence of events, project milestones, historical timelines, or process flows. The green color template offers a vibrant and refreshing backdrop for presenting timelines, conveying a sense of growth, harmony, and balance. Its visually appealing design helps capture attention and maintain engagement while effectively communicating the chronological progression of events or tasks. With its intuitive layout and color scheme, this template enhances clarity and comprehension of time-related information.
Features of this template
- 100% customizable slides and easy to download.
- The slide contains 16:9 and 4:3 formats.
- Easy to change the colors of the slide quickly.
- Highly compatible with PowerPoint and Google Slides.


You May Also Like These PowerPoint Templates
Add to Wishlist
Download
AI Customize

Add to Wishlist
Download
AI Customize

Add to Wishlist
Download
AI Customize

Add to Wishlist
Download
AI Customize


Add to Wishlist
Download
AI Customize


Add to Wishlist
Download
AI Customize

Add to Wishlist
Download
AI Customize

Add to Wishlist
Download
AI Customize

Add to Wishlist
Download
AI Customize

Add to Wishlist
Download
AI Customize


Add to Wishlist
Download
AI Customize


Add to Wishlist
Download
AI Customize

Add to Wishlist
Download
AI Customize

Add to Wishlist
Download
AI Customize

Add to Wishlist
Download
AI Customize

Add to Wishlist
Download
AI Customize
