Free - Supply Chain Performance Infographic PPT And Google Slides
Free

 Canva
Canva
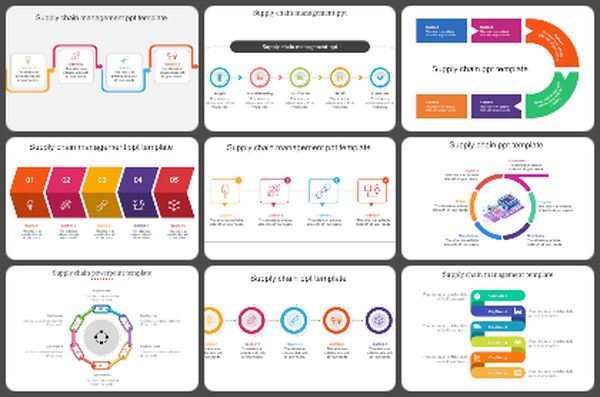
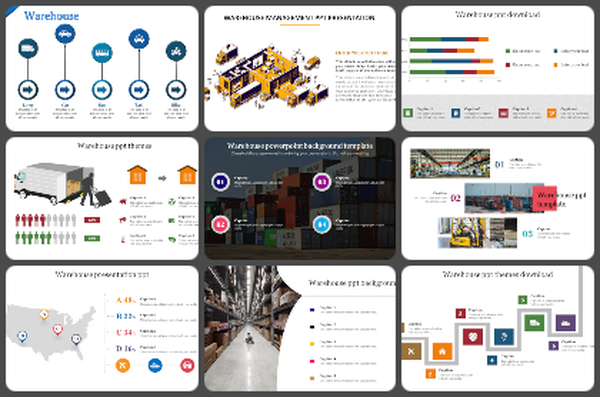
Supply Chain Performance Infographic Presentation Template
Most teams don’t struggle with what to present. They struggle with how many times they have to present the same idea to different audiences. One slide never fits all. This template solves that by giving you multiple infographic formats for the supply chain performance story.
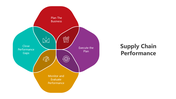
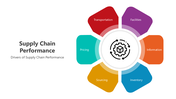
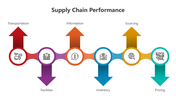
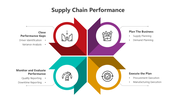
Every slide focuses on the same core areas—performance metrics, operational cycle, and supply chain drivers—but each uses a different visual structure. You get circular diagrams, directional flows, segmented blocks, and step-based layouts. You can choose the format based on the audience, not rebuild the content.
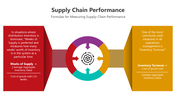
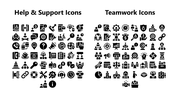
The metrics slide highlights Inventory Turnover and Weeks of Supply. Other slides repeat the same drivers—facilities, inventory, sourcing, pricing, transportation, and information—across different visual styles. The performance cycle (plan, execute, monitor, close gaps) is also presented in multiple layouts.
This allows you to switch between executive summaries, team discussions, and detailed reviews without redesigning slides. Use these supply chain performance slides when your content stays the same, but your audience changes.
Features of this template:
- Edit text, colors, icons, and infographic layouts
- Works in PowerPoint, Google Slides, and Canva
- Supports both 16:9 and 4:3 formats
- Same supply chain content repeated across multiple infographic styles
- Multiple layouts for performance cycle representation
- Reusable visuals for Inventory Turnover and Weeks of Supply
- Six supply chain drivers are shown in different diagram formats
- Flexible slide selection based on audience type
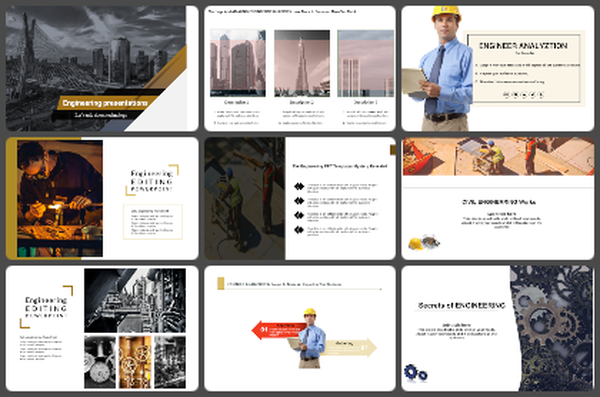
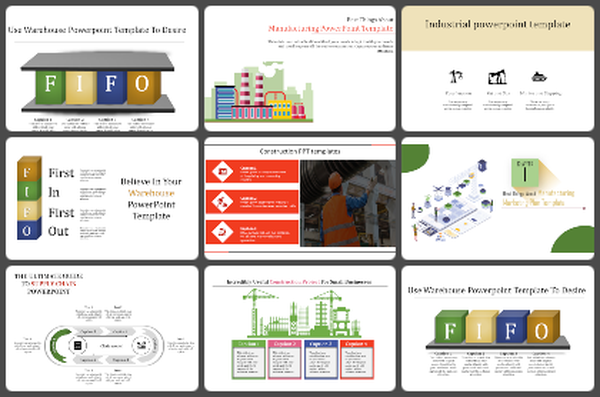
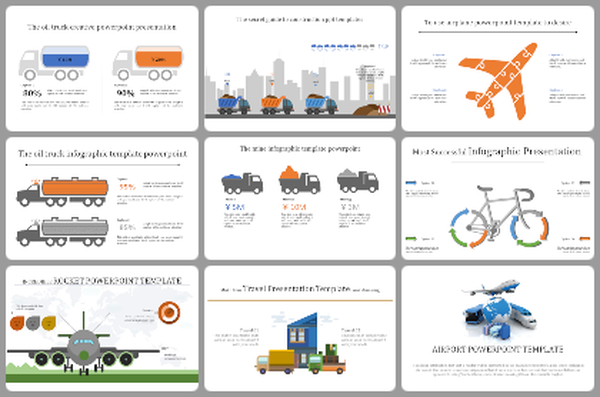
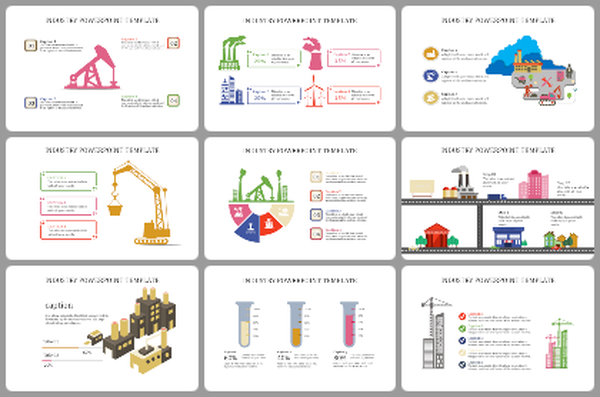
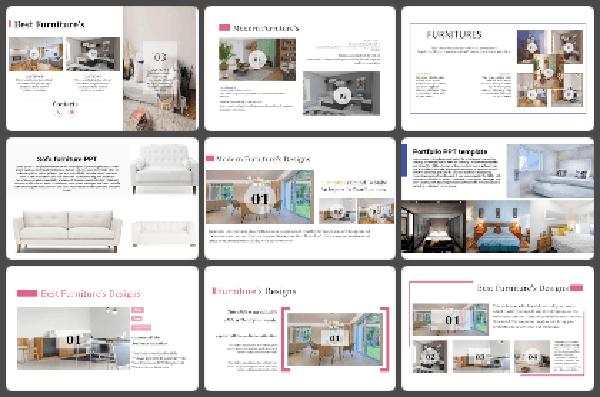

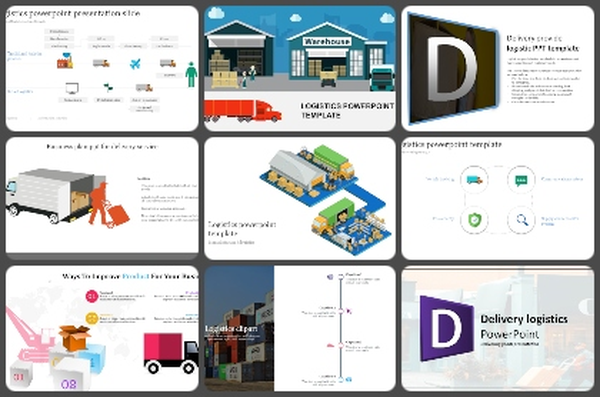
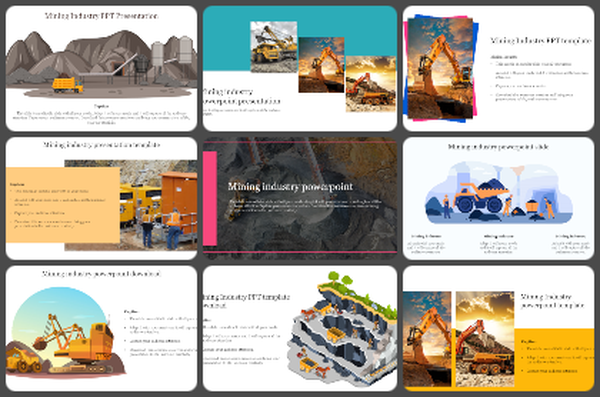
You May Also Like These PowerPoint Templates


Add to Wishlist
Download
Edit


Add to Wishlist
Download
Edit

Add to Wishlist
Download
Edit

Add to Wishlist
Download
Edit

Add to Wishlist
Download
Edit


Add to Wishlist
Download
Edit

Add to Wishlist
Download
Edit

Add to Wishlist
Download
Edit


Add to Wishlist
Download
Edit

Add to Wishlist
Download
Edit

Add to Wishlist
Download
Edit


Add to Wishlist
Download
Edit


Add to Wishlist
Download
Edit

Add to Wishlist
Download
Edit

Add to Wishlist
Download
Edit

Add to Wishlist
Download
Edit

Add to Wishlist
Download
Edit

Add to Wishlist
Download
Edit

Add to Wishlist
Download
Edit

Add to Wishlist
Download
Edit


Add to Wishlist
Download
Edit


Showing36 of69,218 templates