Supply Chain Analytics PowerPoint And Google Slides

 Canva
Canva
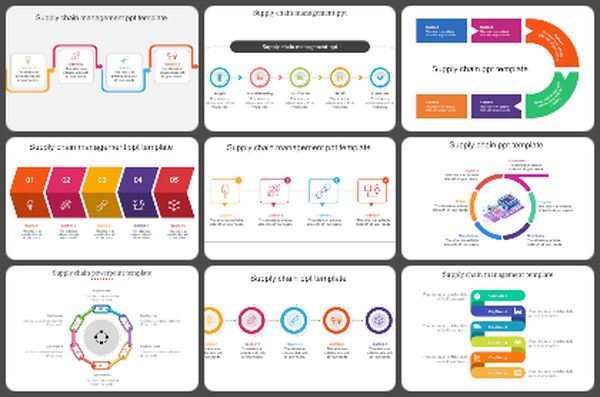
Supply Chain Analytics Presentation Template
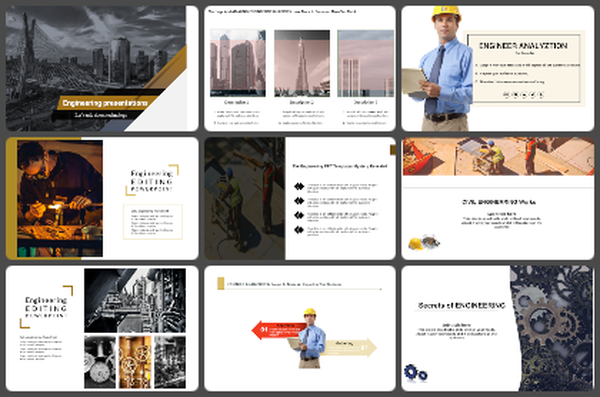
Complex supply chain data creates friction in boardrooms when presented as text-heavy lists. Viewers struggle to synthesize logistics, inventory, and procurement metrics without visual anchors. This deck transforms raw data into intuitive, actionable models.
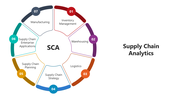
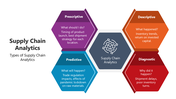
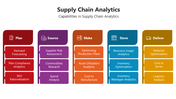
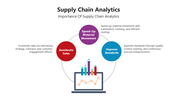
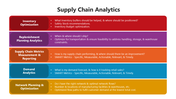
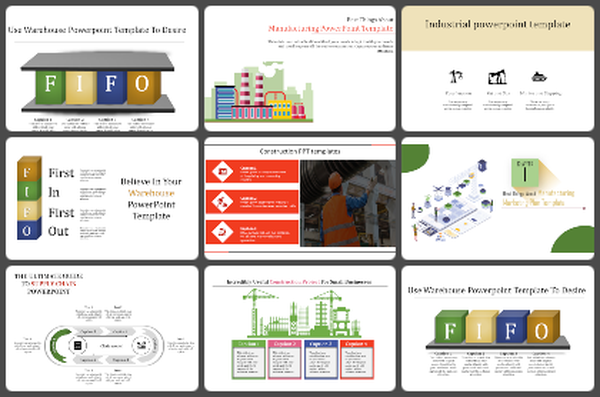
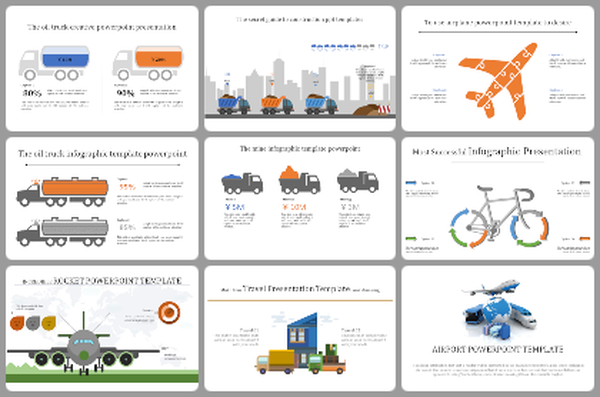
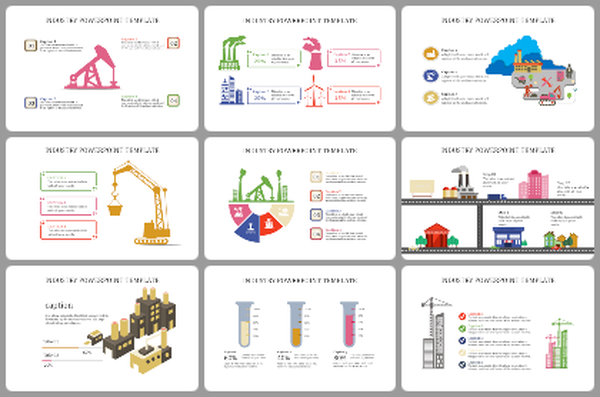
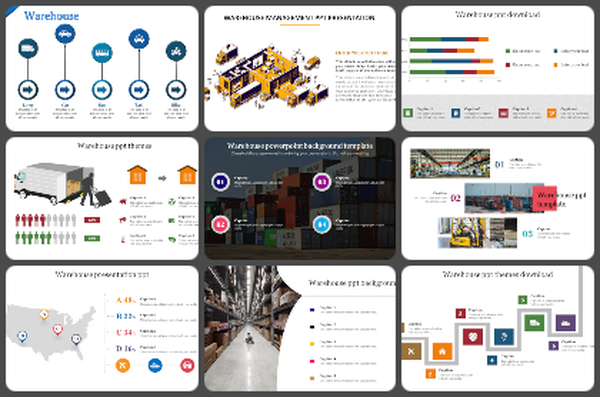
Five core slide layouts organize this flow. A central circular hub maps the relationship between manufacturing, warehousing, and logistics. Horizontal flowcharts trace linear progress. Color-coded grids allow for side-by-side variable comparisons, while segmented timeline slides clarify historical milestones.
The visual system relies on high-contrast color blocks and dedicated icon sets. These elements categorize complex inputs, ensuring the audience tracks your logic without manual explanation. Supply chain managers and operations leads use this template to condense system architecture into digestible visuals for stakeholder meetings. It removes the need for custom design work.
Download this template to standardize your reporting and clarify your strategy immediately.
Features of this template:
- Easy to customize: Edit text, colors, and layouts.
- Works on all platforms: Use in PowerPoint, Google Slides, and Canva.
- Screen-friendly format: Fits standard presentation screens and projectors.
- Circular model: Shows connected supply chain parts.
- Grid layouts: Compare performance points side by side.
- Linear flows: Present logistics steps in order.
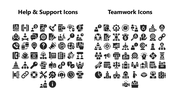
- Icon-based sections: Identify key supply chain areas quickly.
- Timeline visuals: Show production or delivery stages by time.
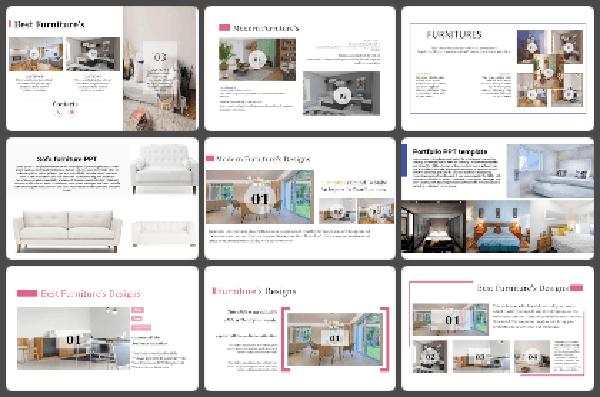

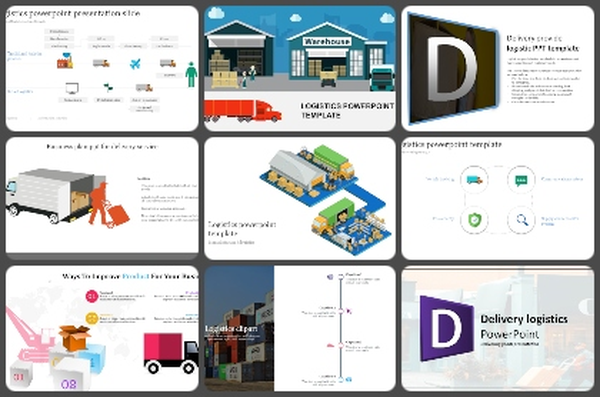
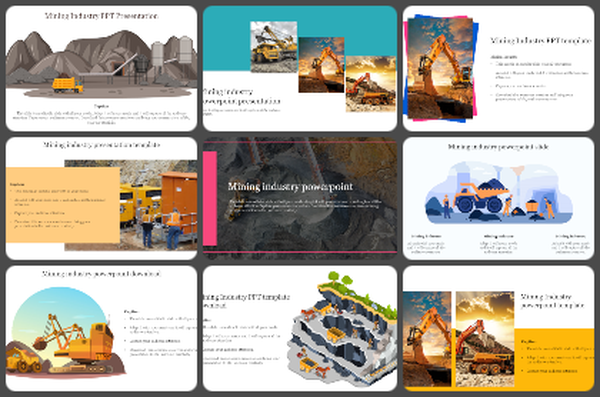
You May Also Like These PowerPoint Templates
Add to Wishlist
Download
AI Customize


Add to Wishlist
Download
AI Customize

Add to Wishlist
Download
AI Customize

Add to Wishlist
Download
AI Customize

Add to Wishlist
Download
AI Customize

Add to Wishlist
Download
AI Customize

Add to Wishlist
Download
AI Customize

Add to Wishlist
Download
AI Customize

Add to Wishlist
Download
AI Customize

Add to Wishlist
Download
AI Customize

Add to Wishlist
Download
AI Customize

Add to Wishlist
Download
AI Customize

Add to Wishlist
Download
AI Customize

Add to Wishlist
Download
AI Customize

Add to Wishlist
Download
AI Customize

Add to Wishlist
Download
AI Customize

Add to Wishlist
Download
AI Customize

Add to Wishlist
Download
AI Customize

Add to Wishlist
Download
AI Customize
