Risk Heat Map PowerPoint Template and Google Slides

 Canva
Canva

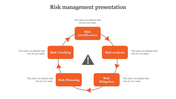

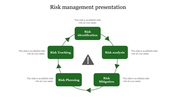
Risk Heat Map Presentation Slide
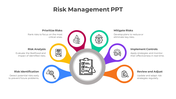
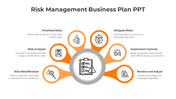
A risk heat map is a visual tool used to display and analyze the level of risk associated with certain factors or events. It uses colors to represent the degree of risk, with high-risk factors shown in red, moderate-risk in yellow, and low-risk in green. Risk Assessment PPT are commonly used in project management, financial planning, and other industries to identify and prioritize potential risks, develop mitigation strategies, and communicate risk levels to stakeholders. This template provides a visual tool to assess and analyze potential risks based on their likelihood and severity. It is a valuable resource for risk managers and project managers involved in risk assessment and management.
Features of the Template
- 100% customizable slides and easy to download.
- The slide contains 16:9 and 4:3 formats.
- Slides are available in different nodes & colors.
- Easy to change the colors of the slide quickly.
- Well-crafted template with an instant download facility.
- It can be used for both PowerPoint & Google Slide


You May Also Like These PowerPoint Templates
Add to Wishlist
Download
AI Customize

Add to Wishlist
Download
AI Customize

Add to Wishlist
Download
AI Customize

Add to Wishlist
Download
AI Customize


Add to Wishlist
Download
AI Customize

Free
Add to Wishlist
Download
AI Customize

Add to Wishlist
Download
AI Customize

Add to Wishlist
Download
AI Customize

Add to Wishlist
Download
AI Customize


Add to Wishlist
Download
AI Customize

Add to Wishlist
Download
AI Customize


Add to Wishlist
Download
AI Customize

Add to Wishlist
Download
AI Customize

Add to Wishlist
Download
AI Customize

Add to Wishlist
Download
AI Customize
