160+ Fish Bone Presentation Templates

Everyone has ideas about what went wrong. Most teams ignore half of them. Fishbone diagrams help you listen to perspectives without dismissing anyone. You might find the real cause in someone's input.
Free
Add to Wishlist Download Edit
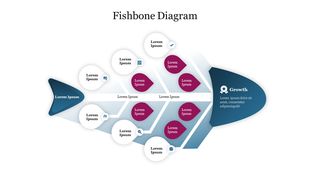
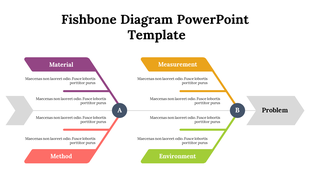
Horizontal fishbone layout with labeled causes branching diagonally from the central line, leading to a final growth outcome.
Free
Add to Wishlist Download Edit
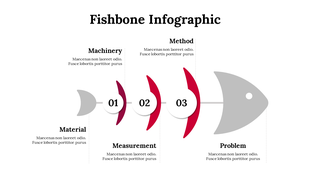
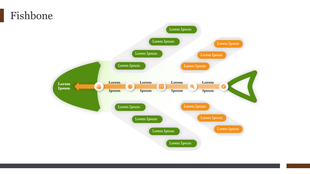
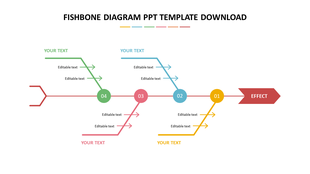
Infographic resembling a fishbone structure, with five segments, connected by red arrows toward the right.
Free
Add to Wishlist Download Edit
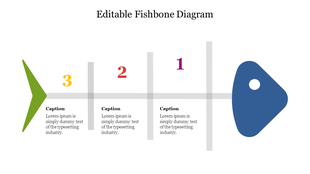
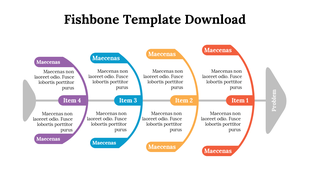
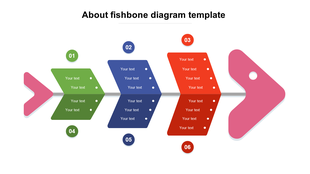
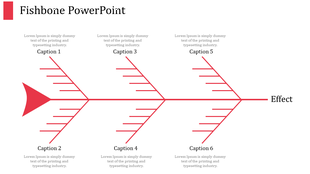
Fishbone diagram with numbered sections in purple, red, and yellow, connected to a central blue head and green tail.
Free
Add to Wishlist Download Edit
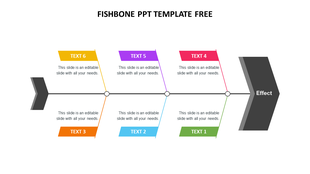
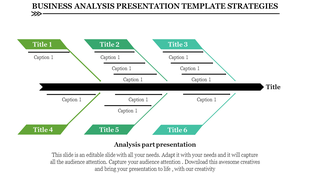
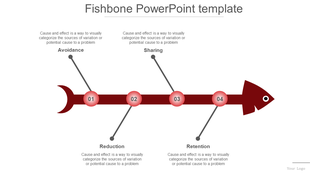
Fishbone diagram with six diagonal text boxes in green, blue, orange, pink, purple, and yellow, leading to a dark arrow.
Free
Add to Wishlist Download Edit
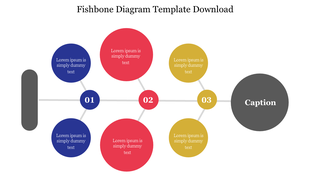
Horizontal fishbone diagram with three numbered sections in blue, red, and yellow circles, leading to a large gray caption.
Free
Add to Wishlist Download Edit
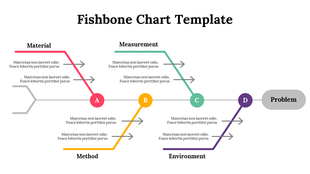
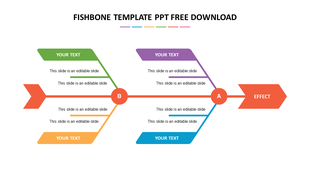
Fishbone diagram with a central red spine connecting green, purple, orange, and blue branches leading to an effect arrow.
Free
Add to Wishlist Download Edit
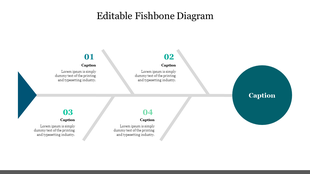
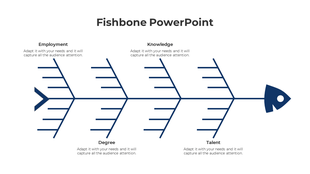
Fishbone diagram with four labeled branches, each containing a caption and placeholder text, leading to a endpoint.
Free
Add to Wishlist Download Edit
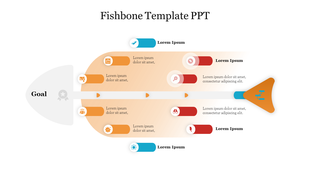
 A template with fishbone layout, featuring sections labeled with icons and placeholder text, indicating different goal.
Free
Add to Wishlist Download Edit
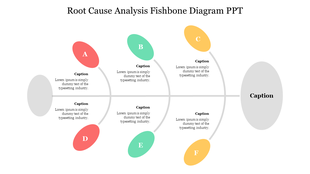
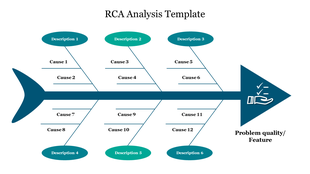
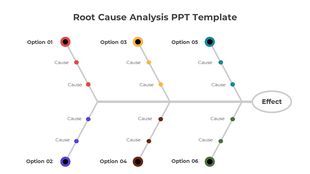
Diagram illustrating root cause analysis with six options branching out to various causes, culminating in an effect.
Free
Add to Wishlist Download Edit
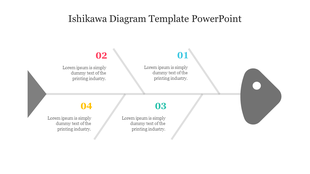
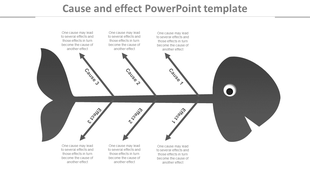
Ishikawa diagram in grayscale, shaped like a fish with arrows pointing from three causes to three effects.
Free
Add to Wishlist Download Edit
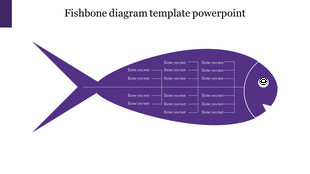
Purple fishbone diagram PowerPoint template with placeholder text lines for categorizing causes and effects.
Free
Add to Wishlist Download Edit
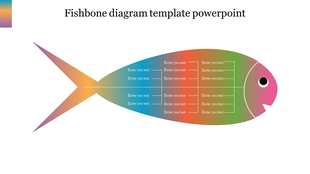
Multicolor fishbone diagram with gradient shades of yellow, blue, orange, green, and pink, featuring labeled sections.
Free
Add to Wishlist Download Edit
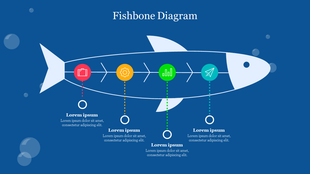
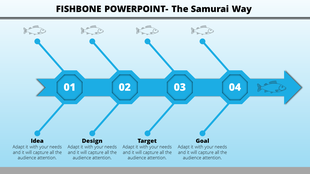
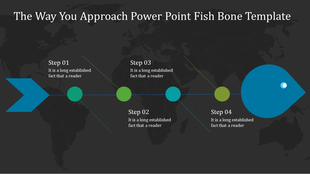
Blue fishbone timeline with hexagonal steps for idea, design, target, and goal, ending in a directional arrow.
Free
Add to Wishlist Download Edit
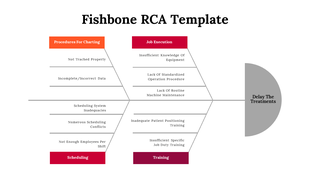
Fishbone diagram template with labeled categories branching to identify causes of treatment delays.
Free
Add to Wishlist Download Edit
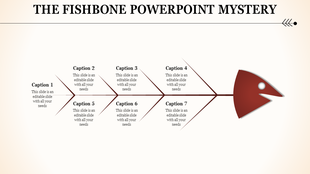
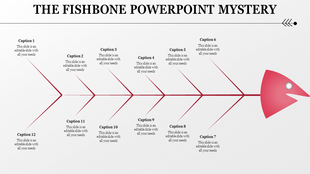
Fishbone diagram template featuring a red fishbone shows the effect and causes, each labelled with a caption areas.
Free
Add to Wishlist Download Edit
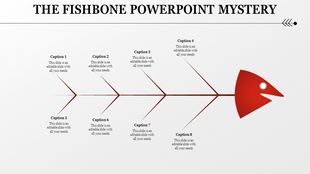
Fishbone diagram PowerPoint slide with red bones and eight captions for problem solving or brainstorming ideas.
Free
Add to Wishlist Download Edit
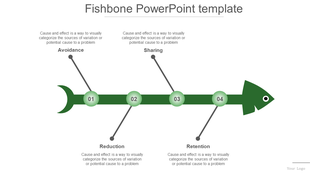
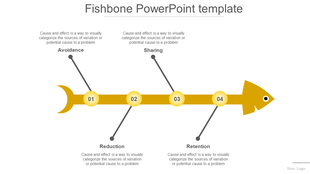
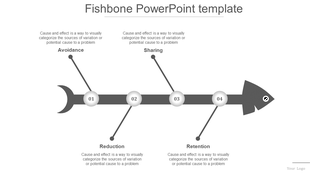
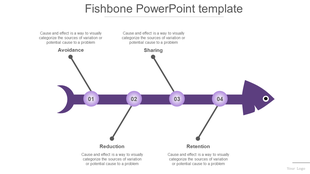
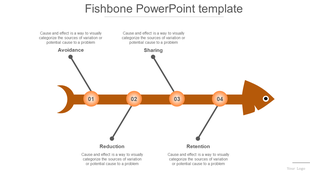
Fishbone PowerPoint template with four steps, represented by nodes along a horizontal line, ending in a fish like shape.
Free
Add to Wishlist Download Edit
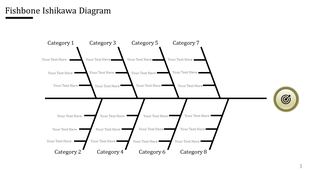
Ishikawa Fishbone Diagram slide with categories for problem analysis with 8 categories and placeholder text.
Free
Add to Wishlist Download Edit
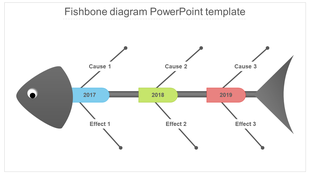
Fishbone diagram slide with a gray fish skeleton design, highlighting causes and effects for the years 2017, 2018, and 2019.
Free
Add to Wishlist Download Edit
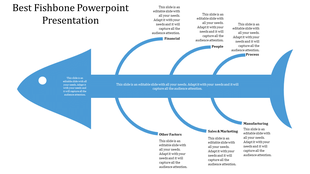
Fishbone infographic showing six categories of issues from financial to manufacturing in a white backdrop.
Free
Add to Wishlist Download Edit
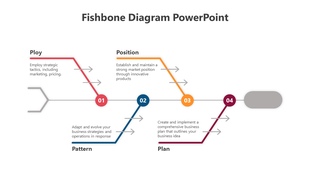
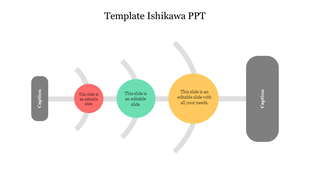
Fishbone diagram layout with red, green, and yellow circular nodes connecting gray side captions in a flow.
Got a Unique Idea? Craft with AI
Credits left : 0

Problem-Solving Made Simple with Free Fish Bone PowerPoint Templates and Google Slides Themes!


A fishbone diagram is a simple tool that helps you find the root of a problem. It looks like a fish skeleton. The head of the fish is your main problem, and the bones are the possible cause. People use these diagrams to sort out why something went wrong. They are great for figuring out not just one big reason, but many little ones that add up. To use this diagram, start with your problem. Draw it on one side of your paper. Then, draw lines for each big reason things might go wrong. Add smaller lines to dig into more details.

Our Fish Bone PPT Template Offerings:

We have a variety of templates to help you:

  • Cause And Effect: See how different reasons lead to your main problem.
  • Free Ishikawa Diagram: Get a detailed look at complex issues for free.
  • Root Cause Analysis: Find the deepest reasons behind problems.
  • Fishbone Analysis: Step by step, explore all possible causes.

Why Our Slides? 

Our templates use colors that are bright but not too strong. They turn tough info into something easy to get. They are special because they are:

  • Good Looking: With colors and designs that catch the eye.
  • Simple to Use: Easy to change and ready to use in your talks.

More Good Things About Our Free Fishbone Diagram PowerPoint Templates: 

You can choose from many styles. They are free to change (100% editable) and use over and over (royalty-free). Pick from different sizes (4:3 & 16:9), and ways to show them, like tall or wide. We even have some you can try without paying.

Who Should Use These Fishbone Diagram PPT Templates? 

Our templates are for anyone who needs to explain tricky things in a simple way. This includes students, teachers, and anyone talking at work.

Take Action Now! Start using our “Fishbone presentation templates” today. Make your next talk one people will remember. With our help, you’re not just giving facts. You’re telling a story. Let’s tell a great one together.

Explore Similar Collections

Frequently Asked Questions

1. How do I present a fishbone diagram so my team understands it?

Make it visual and clear. Fishbone templates do that automatically. Your analysis is already complex — the diagram shouldn't be. Templates ensure the design doesn't get in the way of your message.

2. I'm presenting this to leadership. Will it look professional?

Yes. Templates are built for that exact scenario. You're presenting analysis, not showing off design skills. Templates let leadership focus on your findings, not on how the diagram looks.

3. My team is spread across locations. How do I share this effectively?

Digital templates export cleanly to PDF, images, and slides. Your diagram looks the same whether it's projected, emailed, or printed. No formatting issues, no surprises.

4. What if people misunderstand the diagram?

Clear structure helps. Templates organize causes logically so people follow your thinking. When the diagram is easy to read, your message gets through. That's the whole point.

5. Can I walk through the diagram step-by-step in a presentation?

Yes. You can animate it, reveal causes one at a time, or walk through it verbally. Templates are flexible enough for live presentations or static reports.

6. How do I make sure everyone sees this the same way?

Consistent design helps. When everyone's working from the same template, the diagram looks unified. People see the same structure you're seeing. No confusion from mismatched visuals.

7. This diagram will be in our report. Does it need to look a certain way?

Yes. Professional formatting matters in documents. Templates ensure your diagram fits your report's standards. It looks intentional, not thrown together.