Best Pareto Principle Definition PPT and Google Slides

Circular diagram with 80% and 20% labels on both sides, connected by orange and blue sections around a central circle.
P.ID : 62649
    509 views
    69 Downloads
    Get Custom Slides by Experts
    Instantly Access Templates in PowerPoint

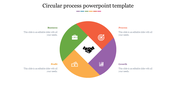
    Four Noded PPT Slide On Pareto Principle Theme

    Download this Pareto Principle Definition PowerPoint Presentation Template to make an informative presentation to explain the principles and concepts. Using this template, you can present the principles with ease. It is 100% editable and customizable, so you can easily add your own words and explanations to it. Business owners and senior managers can use this slide to make a professional presentation template.

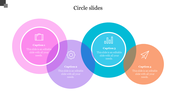
    The Pareto Principle Definition PowerPoint Presentation Template includes innovative graphics illustrating the  80-20 rule. This four noded slide can help business professionals to understand the concept in a simple manner. The non-circular graphics used in this slide will make your presentations unique. It can also help you analyze various stocks and products.

    Features of this template:

    1. 100% customizable slides and easy to download.
    2. Slides available in different nodes & colors.
    3. The slide contained 16:9 and 4:3 format.
    4. Easy to change the slide colors quickly.
    5. Well-crafted template with instant download facility.
    6. It has a multicolor layout with non-circular graphics.
    Advertisement

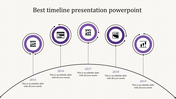
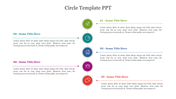
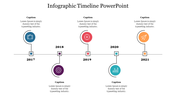
    You May Also Like These PowerPoint Templates

    Add to Wishlist
    Download
    AI Customize
    Four orange circular icons with business strategy symbols arranged horizontally on a white background.
    Add to Wishlist
    Download
    AI Customize
    Circular layout with six colorful arrows in blue, green, orange, purple, teal, and red, encircling a globe.
    Add to Wishlist
    Download
    AI Customize
    Business PPT slide with a circular design showing key concepts like target, time, profit, and search, each with icons.
    Add to Wishlist
    Download
    AI Customize
    PowerPoint circle diagram with four steps, colorful icons representing different processes, and a central title section.
    Add to Wishlist
    Download
    AI Customize
    Circle Design Process Slides PowerPoint Presentation
    Free
    Add to Wishlist
    Download
    AI Customize
    Five gray circular icons with numbered captions arranged in a zigzag infographic, on a white backdrop.
    Add to Wishlist
    Download
    AI Customize
    Circle infographic with four numbered circles in blue, red green and yellow  connected to captions on alternating sides.
    Add to Wishlist
    Download
    AI Customize
    Modern business PowerPoint slide from planner to business report with colorful icons and placeholder text.
    Free
    Add to Wishlist
    Download
    AI Customize
    Grey circle PowerPoint template with four sections labeled Business, Process, Target, and Growth, each with icons.
    Add to Wishlist
    Download
    AI Customize
    Four overlapping circles in red, orange, yellow, and teal with icons inside, and matching text boxes around it.
    Free
    Add to Wishlist
    Download
    AI Customize
    Our Professional Business PPT Templates For Presentation
    Free
    Add to Wishlist
    Download
    AI Customize
    SWOT analysis PPT template featuring sections for Strength, Weakness, Opportunity, and Threats, with grey colored icons.
    Free
    Add to Wishlist
    Download
    AI Customize
    How To Make PPT Template - Circular Infographic Design
    Add to Wishlist
    Download
    AI Customize
    Multicolor Circle Template PowerPoint Presentation
    Add to Wishlist
    Download
    AI Customize
    3D circle PowerPoint template with six steps, featuring a running figure, and labeled from 1 to 6.
    Add to Wishlist
    Download
    AI Customize
    Colorful circular process diagram slide with three gears labeled 1, 2, and 3 showing steps in a cycle with placeholder text.
    Add to Wishlist
    Download
    AI Customize
    Four overlapping circles in red and purple with sequential numbers 01 to 04, with labeled processes, on a white background.
    Add to Wishlist
    Download
    AI Customize
    A PPT timeline slide with years 2012 to 2019, each marked with red circles containing various icons representing stages.
    Add to Wishlist
    Download
    AI Customize
    Business infographic with a node linked to four icons document, bar chart, target, and money, each labeled with captions.