Monthly Report PowerPoint Template for Google Slides

Monthly report slide with a grid layout, representing activities with relevant icons and placeholder text.
P.ID : 53035
    3.3K+ views
    231 Downloads
    Get Custom Slides by Experts
    Instantly Access Templates in PowerPoint

    Monthly Report Presentation Slide

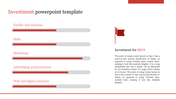
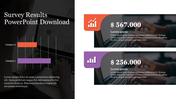
    A monthly report related to a launched product, promotion, or press release typically includes information on the performance and effectiveness of these activities over the course of a month. The report may include metrics such as website traffic, social media engagement, leads generated, and sales revenue, as well as an analysis of the effectiveness of various promotional channels and strategies. It may also highlight any notable press coverage or media mentions and their impact on the product or brand. This report is valuable for assessing the success of promotional activities and identifying areas for improvement to optimize future campaigns. This template can help you enhance the message with our visually engaging template, leaving a lasting impression on your audience.

    Features of the template

    • 100% customizable slides and easy to download. 
    • Easy to change the slide's colors.
    • Highly compatible with PowerPoint and Google Slides.
    • It further supports an aspect ratio of 16:9 and 4:3 format
    • This slide has a colorful design pattern.
    Advertisement

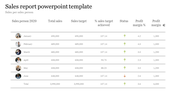
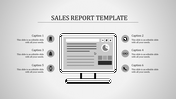
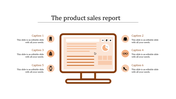
    You May Also Like These PowerPoint Templates

    Add to Wishlist
    Download
    AI Customize
    Illustration of a business team discussing annual report strategies with data icons in the green background.
    Add to Wishlist
    Download
    AI Customize
    Annual report chart showing income percentages for four categories, with accompanying text for a quarter expansion.
    Add to Wishlist
    Download
    AI Customize
    3D bar chart company report featuring cone-shaped data points for January, February, and March under four categories.
    Add to Wishlist
    Download
    AI Customize
    3D triangular bar chart in yellow, orange, and blue shades showing monthly data for four categories, on a dark background.
    Add to Wishlist
    Download
    AI Customize
    Infographic with bar graphs in red, purple, yellow, and orange emerging from a smartphone, representing monetary values.
    Add to Wishlist
    Download
    AI Customize
    A weekly report layout with colored headers for each day of the week and space for tasks.
    Free
    Add to Wishlist
    Download
    AI Customize
    Sales report slide with a computer screen displaying product sales data, including a pie chart and icons with captions.
    Free
    Add to Wishlist
    Download
    AI Customize
    Flat style product sales template with a purple monitor displaying analytics, with six fashion item icons arranged around it.
    Free
    Add to Wishlist
    Download
    AI Customize
    Sales strategy slide with a donut chart divided into six colorful segments for acquisition sources and labeled percentages.
    Add to Wishlist
    Download
    AI Customize
    Four colorful diamond shaped icons in blue, orange, green, and purple, arranged horizontally on a white background.
    Add to Wishlist
    Download
    AI Customize
    3D pie chart in gradient shades, with six labeled sections representing various company expense categories.
    Add to Wishlist
    Download
    AI Customize
    Attractive Weekly Planner Template for Presentation
    Add to Wishlist
    Download
    AI Customize
    Sales report PPT template featuring a computer screen with data, charts, and colorful icons.
    Free
    Add to Wishlist
    Download
    AI Customize
    An annual sales template with sections labeled Heading 1 to 5 and a pie chart illustrating various percentages with text.
    Add to Wishlist
    Download
    AI Customize
    Bar chart with blue, green, and yellow bars on the left, three circular icons with captions on the right.
    Free
    Add to Wishlist
    Download
    AI Customize
    Business plan slide showing a bar chart with eight columns, featuring labeled years from 2019 to 2026, in blue tones.
    Add to Wishlist
    Download
    AI Customize
    Stacked bar chart showing monthly data with red, green, and blue segments, labeled January to December.
    Add to Wishlist
    Download
    AI Customize
    Annual report presentation slide with a modern office interior and company name and address highlighted in red and white.