Free - Get Sales Report Template Presentation Slides Design

Free
Flat style product sales template with a purple monitor displaying analytics, with six fashion item icons arranged around it.
P.ID : 22042
    398 views
    69 Downloads
    Get Custom Slides by Experts
    Instantly Access Templates in PowerPoint

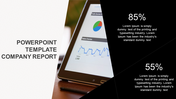
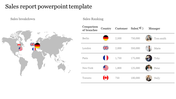
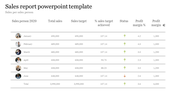
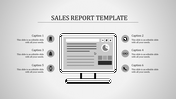
    Elegant  Product Sales Report PPT Template

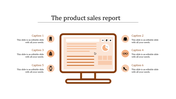
    Innovate your sales report presentations with our Simple Product Sales Report PowerPoint Slide. You can utilize this slide to present your product and sales performance effectively. The template is made with clipart graphics of a report on the monitor screen that looks relatable to your idea. The six nodes with elegant icons and ample text space look elegant. You can employ this slide in your business, sales, annual, investors, shareholders, and client meetings PPTs. Entice better new clients and earn more profit with this template.

    Features of the template

    • 100% customizable slides and easy to download.
    • Slides are available in different nodes & colors.
    • The slide contained 16:9 and 4:3 formats.
    • Easy to change the slide colors quickly.
    • Well-crafted template with instant download facility.
    • Perfect slide for product & report PPTs.
    • Premium quality at free of cost.
    Advertisement

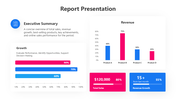
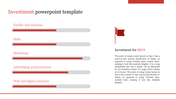
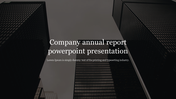
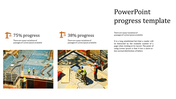
    You May Also Like These PowerPoint Templates

    Add to Wishlist
    Download
    AI Customize
    3D bar chart company report featuring cone-shaped data points for January, February, and March under four categories.
    Add to Wishlist
    Download
    AI Customize
    3D triangular bar chart in yellow, orange, and blue shades showing monthly data for four categories, on a dark background.
    Add to Wishlist
    Download
    AI Customize
    Infographic with bar graphs in red, purple, yellow, and orange emerging from a smartphone, representing monetary values.
    Add to Wishlist
    Download
    AI Customize
    A weekly report layout with colored headers for each day of the week and space for tasks.
    Free
    Add to Wishlist
    Download
    AI Customize
    Sales report slide with a computer screen displaying product sales data, including a pie chart and icons with captions.
    Free
    Add to Wishlist
    Download
    AI Customize
    Flat style product sales template with a purple monitor displaying analytics, with six fashion item icons arranged around it.
    Free
    Add to Wishlist
    Download
    AI Customize
    Sales strategy slide with a donut chart divided into six colorful segments for acquisition sources and labeled percentages.
    Add to Wishlist
    Download
    AI Customize
    Four colorful diamond shaped icons in blue, orange, green, and purple, arranged horizontally on a white background.
    Add to Wishlist
    Download
    AI Customize
    3D pie chart in gradient shades, with six labeled sections representing various company expense categories.
    Add to Wishlist
    Download
    AI Customize
    Attractive Weekly Planner Template for Presentation
    Add to Wishlist
    Download
    AI Customize
    Sales report PPT template featuring a computer screen with data, charts, and colorful icons.
    Add to Wishlist
    Download
    AI Customize
    Bar chart with blue, green, and yellow bars on the left, three circular icons with captions on the right.
    Free
    Add to Wishlist
    Download
    AI Customize
    Business plan slide showing a bar chart with eight columns, featuring labeled years from 2019 to 2026, in blue tones.
    Add to Wishlist
    Download
    AI Customize
    Stacked bar chart showing monthly data with red, green, and blue segments, labeled January to December.
    Add to Wishlist
    Download
    AI Customize
    Annual report presentation slide with a modern office interior and company name and address highlighted in red and white.
    Add to Wishlist
    Download
    AI Customize
    Company annual report timeline with speech bubbles displaying percentage data gray pink, blue, and purple .
    Add to Wishlist
    Download
    AI Customize
    Financial report template with two tables comparing current and long liabilities over four time periods from 2013 to 2020.