Effective Report PowerPoint Presentation Template

 Canva
Canva


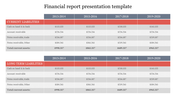


Report Presentation Template
Slide Description:
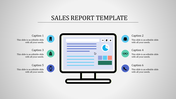
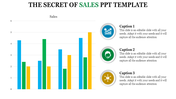
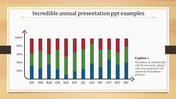
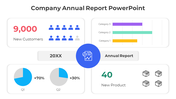
Data-Driven Bar Graphs: The vibrant bar graphs steal the spotlight. Each color represents a different data point – red for revenue, purple for growth, and orange for engagement. Whether you’re presenting financial results, project milestones, or social media metrics, these graphs convey complex information with clarity.
Editable Captions: Beneath the tablet screen, you’ll find four customizable captions. Label them as you wish – “Key Insights,” “Performance Metrics,” “Strategic Goals,” or any other relevant title.
User-Friendly Interface: Our template is user-friendly, allowing you to edit texts, adjust graphs, and personalize content effortlessly.
Who Can Benefit?
Professionals: Consultants, marketers, analysts, and executives can leverage this template for client pitches, board meetings, and internal reports. Impress stakeholders with visually compelling slides that reinforce your message.
Students: From classroom presentations to thesis defenses, students can showcase their research findings, project outcomes, or creative ideas.
Download our template now. Turn every slide into a compelling story, and watch your audience lean in, engage, and remember.
Features of the template:
- Slides are available in 4:3 & 16:9
- Well-crafted template with instant download.
- Get slides that are 100% customizable and easy to download
- Highly compatible with PowerPoint and Google Slides.


You May Also Like These PowerPoint Templates
Add to Wishlist
Download
Edit


Add to Wishlist
Download
Edit

Add to Wishlist
Download
Edit

Add to Wishlist
Download
Edit

Add to Wishlist
Download
Edit

Add to Wishlist
Download
Edit


Add to Wishlist
Download
Edit

Add to Wishlist
Download
Edit

Add to Wishlist
Download
Edit

Add to Wishlist
Download
Edit


Add to Wishlist
Download
Edit


Add to Wishlist
Download
Edit

Add to Wishlist
Download
Edit

Add to Wishlist
Download
Edit

Add to Wishlist
Download
Edit

Add to Wishlist
Download
Edit
