Amazing Infographic For Survey Results Presentation Slide

An infographic slide showing survey results with a pie chart and percentages for 2016, 2017, and 2018, each with icons.
P.ID : 64010
    582 views
    77 Downloads
    Get Custom Slides by Experts
    Instantly Access Templates in PowerPoint

    Explicit Infographic For Survey Results template

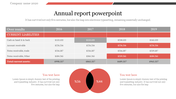
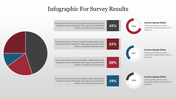
    Infographic For Survey Results template is an excellent template that can easily make the topic clear for the audience. The template is given with a pie chart design PowerPoint which can be deciphered using the four nodes given.


    The template is added with a text area to edit and add information. For example, it is used for survey results or observations of the sales report. The template is added with vibrant colors to differentiate each portion of the pie. The template is fully customized and so editing this template is much easier.

    Make use of the user-friendly features to enhance the view of the templates and make them appealing to the audience. Download thus effective templates and gain the audience's attention. Download now!.

    Features of this template

    • This template is 100% editable.
    • 100% Customizable (shape color, size & text)
    • It supports an aspect ratio of 16:9.
    • Easily readable and acceptable template.
    • Creative design with vibrant colors.
    • Pie chart design with four nodes.
    Advertisement

    You May Also Like These PowerPoint Templates

    Add to Wishlist
    Download
    AI Customize
    Business report PPT with bar and pie charts including sales by location, units per transaction, and customer retention rate.
    Add to Wishlist
    Download
    AI Customize
    Status report table with five phases, colored lines connecting points, and text rows on a gray and white grid background.
    Add to Wishlist
    Download
    AI Customize
    2019 annual report slide design with brown and orange geometric shapes and a building image in the layout.
    Add to Wishlist
    Download
    AI Customize
    Colorful weekly schedule PowerPoint slide with time slots for each day of the week.
    Free
    Add to Wishlist
    Download
    AI Customize
    Annual report slide with a timeline for 2017 to 2019, featuring speech bubbles in gray, pink, and blue, showing percentages.
    Add to Wishlist
    Download
    AI Customize
    Financial report template with slides covering company statements,  analysis, supervisory board reports, and team profiles.
    Add to Wishlist
    Download
    AI Customize
    Company annual report slide with a gray and red graph displaying data with percentage values for investment and profit.
    Free
    Add to Wishlist
    Download
    AI Customize
    Annual report slide displaying a sales bar chart, an rate donut chart, anrevenue line graph, and an growth bar chart.
    Add to Wishlist
    Download
    AI Customize
    Slide with a revenue chart and metrics for daily, weekly, and yearly sales, along with three user graphs.
    Add to Wishlist
    Download
    AI Customize
    Annual report timeline infographic showing five speech bubbles with percentages 40%, 50%, 55%, 60%, 70% from 2015 to 2019.
    Add to Wishlist
    Download
    AI Customize
    Company Annual Report slide featuring sales data, revenue graphs, and gross profit analysis for 20XX.
    Add to Wishlist
    Download
    AI Customize
    Our Predesigned Business Report PowerPoint Template
    Add to Wishlist
    Download
    AI Customize
    Company annual report presentation template with a red, white, and black theme, featuring multiple slides.
    Add to Wishlist
    Download
    AI Customize
    Progress Report Presentation Template and Google Slides
    Add to Wishlist
    Download
    AI Customize
    Annual report slide featuring a colorful fan shaped graphic numbered 01 to 05, and text highlighting financial elements.
    Add to Wishlist
    Download
    AI Customize
    Annual report presentation slides on company strategy, growth, core values, and key facts with icons.
    Add to Wishlist
    Download
    AI Customize
    Best Business Report Infographics PowerPoint Presentation
    Add to Wishlist
    Download
    AI Customize
    Four people seated in a circle using devices, with captions in colored boxes of pink, green, teal, and yellow.