Status Report PowerPoint Template and Google Slides Themes

Dual status report tables displaying numerical data under four column headings, with totals in a blue row.
P.ID : 33746
    892 views
    56 Downloads
    Get Custom Slides by Experts
    Instantly Access Templates in PowerPoint

    Status Report Presentation Template


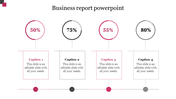
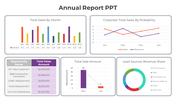
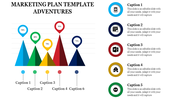
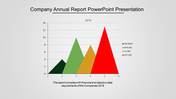
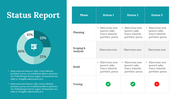
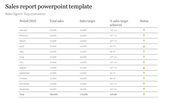
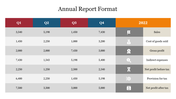
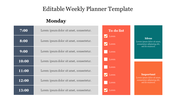
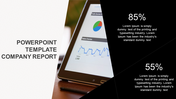
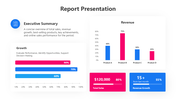
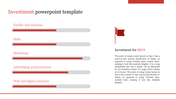
    Keeping your projects on track and everyone informed is crucial. Our Status Report PowerPoint template helps you present project progress clearly and professionally. It includes two sets of tables with four customizable captions each, ideal for showcasing key milestones, progress updates, and challenges. The modern grey theme and clean white background make your data easy to read and understand.

    This template is perfect for project managers, team leaders, or anyone needing to provide project updates. Just enter your project data, adjust the table headers and captions as needed, and present your report confidently. It helps you convey project status, track progress, and spot potential issues early, ensuring your projects stay on track. Ready to simplify your status reports and impress your stakeholders? Download the template today to elevate your project updates with professionalism and clarity.

    Features of the template


    • Slides are available in different nodes & colors.
    • Easy to change the slide colors.
    • Well-crafted template with instant download.
    • Highly compatible with PowerPoint and Google Slides.
    Advertisement

    You May Also Like These PowerPoint Templates

    Add to Wishlist
    Download
    AI Customize
    Weekly report layout PowerPoint slide featuring days of the week and a calendar with placeholder text on a white backdrop.
    Add to Wishlist
    Download
    AI Customize
    Sales report slide with a world map and a ranking table on the right, listing branches, countries, sales, and managers.
    Add to Wishlist
    Download
    AI Customize
    Cute weekly schedule design featuring colorful sticky notes for Monday to Sunday on a purple backdrop.
    Add to Wishlist
    Download
    AI Customize
    A PPT slide showing survey results with bar graphs and financial data on a laptop screen with placeholder text.
    Add to Wishlist
    Download
    AI Customize
    Product sales report slide with a gray monitor illustration and six labeled icons for different item categories.
    Free
    Add to Wishlist
    Download
    AI Customize
    Two percentage sections with construction site images with workers, and a text with title on the right.
    Add to Wishlist
    Download
    AI Customize
    A 3D pie chart with purple, blue, green, teal, and orange segments showing company annual expenses in various categories.
    Add to Wishlist
    Download
    AI Customize
    Illustration of a business team discussing annual report strategies with data icons in the green background.
    Add to Wishlist
    Download
    AI Customize
    Annual report chart showing income percentages for four categories, with accompanying text for a quarter expansion.
    Add to Wishlist
    Download
    AI Customize
    3D bar chart company report featuring cone-shaped data points for January, February, and March under four categories.
    Add to Wishlist
    Download
    AI Customize
    3D triangular bar chart in yellow, orange, and blue shades showing monthly data for four categories, on a dark background.
    Add to Wishlist
    Download
    AI Customize
    Infographic with bar graphs in red, purple, yellow, and orange emerging from a smartphone, representing monetary values.
    Add to Wishlist
    Download
    AI Customize
    A weekly report layout with colored headers for each day of the week and space for tasks.
    Free
    Add to Wishlist
    Download
    AI Customize
    Flat style product sales template with a purple monitor displaying analytics, with six fashion item icons arranged around it.
    Free
    Add to Wishlist
    Download
    AI Customize
    Sales strategy slide with a donut chart divided into six colorful segments for acquisition sources and labeled percentages.
    Add to Wishlist
    Download
    AI Customize
    Four colorful diamond shaped icons in blue, orange, green, and purple, arranged horizontally on a white background.
    Add to Wishlist
    Download
    AI Customize
    3D pie chart in gradient shades, with six labeled sections representing various company expense categories.