Free - Monthly Report PowerPoint Presentation and Google Slides

Free
Pink gradient table with seven rows and four columns including financial data metrics for a monthly report.
P.ID : 53036
    26 slides
    Company annual report presentation template with a red, white, and black theme, featuring multiple slides.
    20 slides
    Annual report presentation slides on company strategy, growth, core values, and key facts with icons.
    36 slides
    Best Business Report Infographics PowerPoint Presentation
    5.3K+ views
    501 Downloads
    Get Custom Slides by Experts
    Instantly Access Templates in PowerPoint

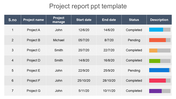
    Monthly Report Presentation Slide

    Monthly reports are a summary of the progress made within a particular month. They help in tracking the achievements, areas of improvement, and potential obstacles that need to be addressed. This template provides a tabular column to record key metrics, such as financial data, project updates, and KPIs. The template is designed to streamline the reporting process, making it easier to gather and analyze data in a concise manner. Use it to enhance productivity and meet goals efficiently. Let's keep moving forward!

    Features of the template

    • 100% customizable slides and easy to download.
    • Slides are available in different nodes & colors.
    • The slide contains 16:9 and 4:3 formats.
    • Easy to change the colors of the slide quickly.
    • Well-crafted template with an instant download facility.
    • Highly compatible with PowerPoint and Google Slides.
    • It is a pre-built design to save time.
    • The elegant look of this template will give life to your presentation.
    Advertisement

    You May Also Like These PowerPoint Templates

    Free
    Add to Wishlist
    Download
    AI Customize
    Annual report slide displaying a bar chart with color-coded percentages from 30% to 80% and caption areas.
    Add to Wishlist
    Download
    AI Customize
    The slide features a colorful donut chart, a table with captions and checkmarks, and a bar graph with a title text area.
    Add to Wishlist
    Download
    AI Customize
    A pack of QBR meaning slides with various colorful layout designs and icons with text descriptions.
    Add to Wishlist
    Download
    AI Customize
    Monthly business review slide showing project names, dates, budgets, and rates in a tabular format with a financial overview.
    Add to Wishlist
    Download
    AI Customize
    Colorful quarterly business review slide showcasing four steps with captions and icons.
    Add to Wishlist
    Download
    AI Customize
    Pack of slides featuring various layouts containing colorful bars indicating metrics on weekly report.
    Free
    Add to Wishlist
    Download
    AI Customize
    Pink gradient table with seven rows and four columns including financial data metrics for a monthly report.
    Add to Wishlist
    Download
    AI Customize
    Colorful quarterly report slide showing bar charts, a pie chart, and task timelines from 2021 to 2024 with three sections.
    Add to Wishlist
    Download
    AI Customize
    Monthly report slide with a grid layout, representing activities with relevant icons and placeholder text.
    Add to Wishlist
    Download
    AI Customize
    Sales report template showcasing key performance metrics with bar and pie charts, set against blue-themed background.
    Add to Wishlist
    Download
    AI Customize
    SEO report slide with a dark background highlighting key metrics in a table format.
    Add to Wishlist
    Download
    AI Customize
    Survey results slide featuring four circular percentage values in different colors with text boxes for placeholder text.
    Add to Wishlist
    Download
    AI Customize
    QBR slide with four icons with descriptions accompanied by a progress bar chart displaying the status for each task.
    Add to Wishlist
    Download
    AI Customize
    Weekly schedule with seven colorful circles for each day, followed by a to do and teal notes section at the bottom.
    Add to Wishlist
    Download
    AI Customize
    Social media reports slide, including color coded bar charts for followers, age demographics, and engagement statistics.
    Add to Wishlist
    Download
    AI Customize
    Dark slide with a graphic of hands holding a tablet, bar charts on the left, and text on the right.
    Add to Wishlist
    Download
    AI Customize
    Teaser slide with a colorful pie chart, bar graph, orange trophy, and a blue line graph, showing different data visuals.
    Add to Wishlist
    Download
    AI Customize
    Slide featuring a colorful incident report with recorded details, and a description of the event with progress percentages.
    Add to Wishlist
    Download
    AI Customize
    Sales report slide featuring a sales summary table, bar graph comparing won and lost sales, and charts for revenue share.