Free - Business Report PowerPoint Templates and Google Slides

Free
Four 3D bar columns in brown, orange, red, and gray with paint icons above and percentage labels, alongside text sections.
P.ID : 3409
    3.4K+ views
    961 Downloads
    Get Custom Slides by Experts
    Instantly Access Templates in PowerPoint

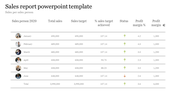
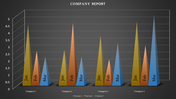
    Business Report Analysis Presentation Slides

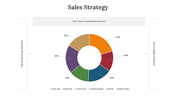
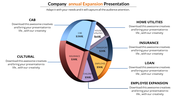
    Are you ready to unlock the secrets of your company's performance? It has never been easier with our Cubical Report template. Discover new insights and uncover hidden patterns with this easy-to-use tool. With its sleek and modern design, you'll be able to present your findings in a clear and engaging way that's sure to impress. So why wait? Start exploring the possibilities today and take your presentations to the next level with percentage markings on our fascinating template.

    Features of the template

    • 100% customizable slides and easy to download.
    • Slides are available in different nodes & colors.
    • The slides contain 16:9 and 4:3 formats.
    • Easy to change the colors quickly.
    • It is a well-crafted template with an instant download facility.
    • Highly compatible with both PowerPoint and Google Slides.
    • A dynamic template with instant marketing terms.
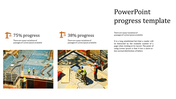
    • It's easy to present the company's growth in percentages.
    Advertisement

    You May Also Like These PowerPoint Templates

    Add to Wishlist
    Download
    AI Customize
    Sales report PPT template featuring a computer screen with data, charts, and colorful icons.
    Add to Wishlist
    Download
    AI Customize
    Bar chart with blue, green, and yellow bars on the left, three circular icons with captions on the right.
    Free
    Add to Wishlist
    Download
    AI Customize
    Business plan slide showing a bar chart with eight columns, featuring labeled years from 2019 to 2026, in blue tones.
    Add to Wishlist
    Download
    AI Customize
    Financial report template with two tables comparing current and long liabilities over four time periods from 2013 to 2020.
    Add to Wishlist
    Download
    AI Customize
    A project report with a graph, calculator, and pencil, placed next to placeholder text on a yellow background.
    Add to Wishlist
    Download
    AI Customize
    Funnel report template showing eight stages, from marketing to report, with corresponding descriptions.
    Add to Wishlist
    Download
    AI Customize
    Effective Company Year In Review Template Presentation
    Add to Wishlist
    Download
    AI Customize
    Monthly schedule template with seven colored tabs for each day and four weekly rows with caption placeholders.
    Free
    Add to Wishlist
    Download
    AI Customize
    Business review PowerPoint slide featuring icons for steps, with captions and a lightbulb icon.
    Add to Wishlist
    Download
    AI Customize
    Weekly planner table with colorful bars indicating tasks for each month from January to June with placeholder text.
    Add to Wishlist
    Download
    AI Customize
    Timeline of weekly project report submissions across four months, using color-coded bars to different report durations.
    Add to Wishlist
    Download
    AI Customize
    An infographic slide showing survey results with a pie chart and percentages for 2016, 2017, and 2018, each with icons.
    Add to Wishlist
    Download
    AI Customize
    Report PowerPoint template showing a workspace with a laptop, clipboard, and stationery on a geometric patterned background.
    Add to Wishlist
    Download
    AI Customize
    Business report PPT with bar and pie charts including sales by location, units per transaction, and customer retention rate.
    Add to Wishlist
    Download
    AI Customize
    Status report table with five phases, colored lines connecting points, and text rows on a gray and white grid background.
    Add to Wishlist
    Download
    AI Customize
    Colorful weekly schedule PowerPoint slide with time slots for each day of the week.
    Add to Wishlist
    Download
    AI Customize
    Slide with a revenue chart and metrics for daily, weekly, and yearly sales, along with three user graphs.