Fascinating Market Analysis PPT Template Themes Design

 Canva
Canva
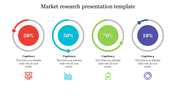

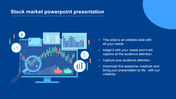

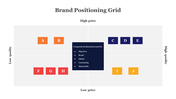

Market Analysis PowerPoint Template
Dive into the realm of strategic analysis with our Market Analysis PowerPoint Template. Against a sleek grey backdrop, a focal white circle takes center stage, symbolizing a holistic market overview. This circle is intelligently partitioned into four segments, each adorned with a distinct percentage – 30%, 50%, 75%, and 80%. These percentages, accompanied by insightful captions, form a compelling visual aid for deciphering market dynamics.
Tailored for professionals engaged in market analysis, this template serves as a powerful tool for illustrating key insights, trends, and data points. Whether you're presenting market research findings, devising a strategic plan, or outlining growth opportunities, this template provides a visually impactful platform.
Compatibility with both "16:9" and "4:3" formats, ensuring adaptability to different presentation settings. Zip format for easy sharing and downloading. 100% Customizable Template: Tailor the template to align with your brand aesthetics and specific presentation needs. Transform Your Market Narratives - Download Now!


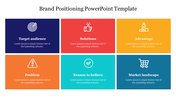
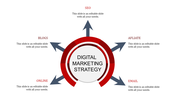
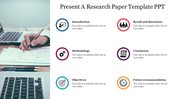
You May Also Like These PowerPoint Templates
Add to Wishlist
Download
AI Customize

Add to Wishlist
Download
AI Customize

Add to Wishlist
Download
AI Customize

Add to Wishlist
Download
AI Customize

Add to Wishlist
Download
AI Customize

Add to Wishlist
Download
AI Customize

Add to Wishlist
Download
AI Customize

Add to Wishlist
Download
AI Customize

Add to Wishlist
Download
AI Customize

Add to Wishlist
Download
AI Customize

Add to Wishlist
Download
AI Customize

Add to Wishlist
Download
AI Customize

Add to Wishlist
Download
AI Customize

Add to Wishlist
Download
AI Customize

Add to Wishlist
Download
AI Customize

Add to Wishlist
Download
AI Customize

Add to Wishlist
Download
AI Customize


Add to Wishlist
Download
AI Customize

Add to Wishlist
Download
AI Customize
