Comprehensive Infographic PPT for Visual Data Representation


Infographic PowerPoint Template and Google Slides
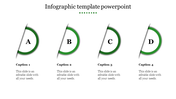
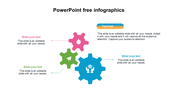
The "Infographic PowerPoint Template and Google Slides" is a visual representation designed in the form of a tree structure, illustrating the relationship between five different concepts: work, target, growth, money, and success. The infographic features a green-and-white color scheme and utilizes a sans-serif font for clarity and modernity.
The Infographic PowerPoint Template and Google Slides are suitable for a wide range of contexts, including business meetings, academic presentations, training sessions, and marketing materials. It can be employed whenever you need to visually represent relationships, hierarchies, or processes to enhance understanding and engagement.
Compatibility with PowerPoint and Google Slides. Available in 16:9 and 4:3 aspect ratios, catering to different screen sizes and presentation preferences. Provided in ZIP format for easy sharing and distribution. Free template with 100% customizable features. Download now.


You May Also Like These PowerPoint Templates
Add to Wishlist
Download
Edit

Add to Wishlist
Download
Edit


Add to Wishlist
Download
Edit

Add to Wishlist
Download
Edit

Add to Wishlist
Download
Edit

Add to Wishlist
Download
Edit

Add to Wishlist
Download
Edit

Add to Wishlist
Download
Edit


Add to Wishlist
Download
Edit


Add to Wishlist
Download
Edit


Add to Wishlist
Download
Edit

Add to Wishlist
Download
Edit
