Financial Performance Highlights PPT And Google Slides

 Canva
Canva

Financial Performance Highlights PPT, Google Slides, and Canva Template
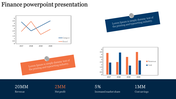
Financial performance highlights provide a snapshot of a company's financial status, offering a summary of key metrics such as income, expenses, net profit, and working capital. This essential data helps business professionals, investors, and decision-makers evaluate a company’s fiscal health at a glance. The highlights typically include crucial elements like accounts payable, receivable, current ratios, and cash flow, which all offer valuable insights into the financial stability and operational efficiency of a business.
Purpose Of The Slides
This Financial Performance Highlights presentation template is designed to provide an efficient and visually appealing way to present key financial data. It highlights important aspects such as revenue, expenses, working capital, and financial ratios, all of which are critical in assessing the company’s performance. The slide deck is perfect for professionals looking to communicate financial results in an easy-to-understand format.
Who Can Use It?
- Business Professionals: Present financial highlights to stakeholders, executives, and investors.
- Students: Learn how to organize and present financial data effectively.
- Entrepreneurs & Investors: Evaluate financial performance when considering business decisions.
Special Key Features
This 1-slide template features a clean, multicolor design, making it simple to customize for your specific financial data. It includes a breakdown of key financials and interactive charts to visualize data trends effectively.
Download the Financial Performance Highlights template now and easily communicate key financial metrics in your next presentation!
Features of this template
- 100% customizable slides and easy to download.
- The slides contain 16:9 and 4:3 formats.
- It is easy to change the colors quickly.
- Highly compatible with PowerPoint, Google Slides, and Canva templates.
You May Also Like These PowerPoint Templates
Add to Wishlist
Download
AI Customize

Add to Wishlist
Download
AI Customize

Add to Wishlist
Download
AI Customize


Add to Wishlist
Download
AI Customize

Add to Wishlist
Download
AI Customize

Add to Wishlist
Download
AI Customize

Free
Add to Wishlist
Download
AI Customize

Add to Wishlist
Download
AI Customize

Add to Wishlist
Download
AI Customize

Add to Wishlist
Download
AI Customize

Add to Wishlist
Download
AI Customize


Add to Wishlist
Download
AI Customize

Add to Wishlist
Download
AI Customize

Add to Wishlist
Download
AI Customize

Add to Wishlist
Download
AI Customize

Add to Wishlist
Download
AI Customize


Add to Wishlist
Download
AI Customize
