Four Node Data Analysis PowerPoint Templates presentation

Business analysis chart showing four labeled nodes in green connected to a central box depicting a person analyzing data.
P.ID : 4523
    257 views
    3 Downloads
    Get Custom Slides by Experts
    Instantly Access Templates in PowerPoint

    Data Analysis PPT Templates and Google Slides

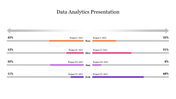
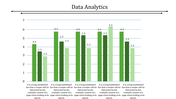
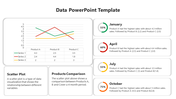
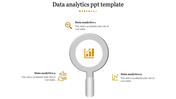
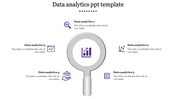
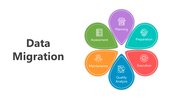
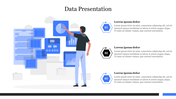
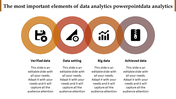
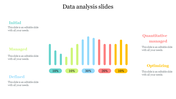
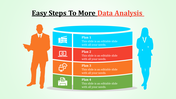
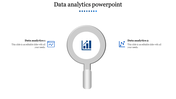
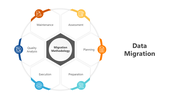
    Crafting compelling presentations for both creative endeavors and business ventures demands striking visual aids. Enter data analysis and visualization PowerPoint templates – the secret sauce to transforming raw information into captivating stories. Picture sleek square designs adorned with four nodes, exuding professionalism through carefully chosen shades. These templates are more than just aesthetically pleasing; they serve as powerful tools for narrating data-driven narratives with finesse. Whether you're unveiling market insights or pitching innovative strategies, these templates effortlessly elevate your presentation game. With their user-friendly interface and dynamic features, they empower presenters to engage audiences and leave a lasting impression. So, the next time you're prepping for a meeting or workshop, let these templates be your trusted companions in delivering impactful presentations that resonate and inspire.

    Features of the template

    • 100% customizable slides and easy to download.
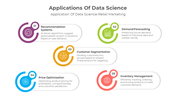
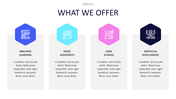
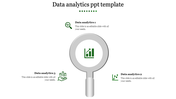
    • Slides are available in different nodes & colors.
    • The slide contains 16:9 and 4:3 formats.
    • Easy to change the colors of the slide quickly.
    • Well-crafted template with an instant download facility.
    Advertisement

    You May Also Like These PowerPoint Templates

    Add to Wishlist
    Download
    AI Customize
    An infographic slide illustrating the skills and responsibilities of a data scientist in a colorful circular model.
    Add to Wishlist
    Download
    AI Customize
    Effective Presentation On Data Analytics Template Slide
    Add to Wishlist
    Download
    AI Customize
    Six Node Business Data Analysis Presentation PowerPoint
    Add to Wishlist
    Download
    AI Customize
    Four colored diamond shapes with curved arrows in the center, surrounded by captions and percentage circles.
    Add to Wishlist
    Download
    AI Customize
    Central magnifying glass with a green graph, surrounded by six data related icons arranged circularly.
    Add to Wishlist
    Download
    AI Customize
    Data analytics template featuring a central magnifying glass and six surrounding icons and caption areas.
    Add to Wishlist
    Download
    AI Customize
    Best Data Analysis PPT Template free Slide
    Add to Wishlist
    Download
    AI Customize
    Best Data Cleansing Infographics PPT And Google Slides
    Add to Wishlist
    Download
    AI Customize
    Easily Use Data Migration PPT And Google Slides Templates
    Add to Wishlist
    Download
    AI Customize
    Slide deck showing data valuation methods, using colorful arrows, text boxes, and icons in a clean and modern layout.
    Add to Wishlist
    Download
    AI Customize
    Data Scientist Responsibilities Google Slides Templates
    Add to Wishlist
    Download
    AI Customize
    Data classification slides illustrate a circular process with four steps with different layout designs and icons.
    Add to Wishlist
    Download
    AI Customize
    A visual diagram explaining the key responsibilities of a data scientist in color coded arrows on a white backdrop.
    Add to Wishlist
    Download
    AI Customize
    A flowchart slides illustrating the data hygiene process with steps in different layout designs accompanied by icons.
    Add to Wishlist
    Download
    AI Customize
    Slide deck comparing the roles of data scientist and engineer, with color coded sections and clear definitions.
    Add to Wishlist
    Download
    AI Customize
    A PPT slide showing various data visualization charts and graphs for data analysis with placeholder text on a blue theme.
    Add to Wishlist
    Download
    AI Customize
    Data scrubbing process diagram PPT slides showcasing steps with different colorful layout designs and icons.
    Free
    Add to Wishlist
    Download
    AI Customize
    Monthly production analysis chart with three color-coded products pink, purple, and blue bars for January to July.