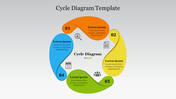
Circle Infographic PowerPoint Template for Engaging Data

Green circular diagram with numbered sections, each featuring a icon representing business functions, with caption areas.
P.ID : 36448
    187 views
    32 Downloads
    Get Custom Slides by Experts
    Instantly Access Templates in PowerPoint

    Infographic PowerPoint Template And Google Slides

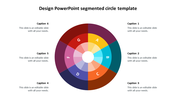
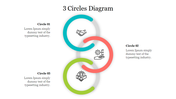
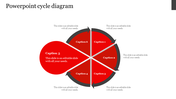
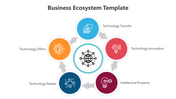
    The "Infographic PowerPoint Template And Google Slides" is a versatile tool designed to create visually appealing circle infographics. It features a central circle divided into six sections, each adorned with an icon and a caption. This template is ideal for individuals and professionals who need to present complex information or data in a clear and visually engaging manner.

    This template is suitable for educators, business professionals, marketers, designers, and anyone else looking to communicate information effectively through visual storytelling. It can be used in various settings such as presentations, reports, educational materials, and more. You can utilize this template to showcase processes, strategies, concepts, data analysis, or any other information that can be segmented into six distinct categories. 

    Compatibility with PowerPoint and Google Slides. Available in both 16:9 and 4:3 aspect ratios, catering to different screen sizes and presentation preferences. Provided in ZIP format for easy sharing and distribution. Free template with 100% customizable features. Download now.
    Advertisement

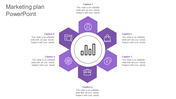
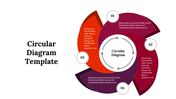
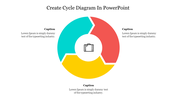
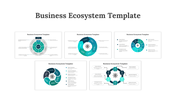
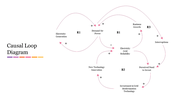
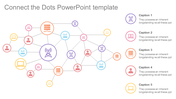
    You May Also Like These PowerPoint Templates

    Free
    Add to Wishlist
    Download
    AI Customize
    Hexagonal red circle infographic with six sections, each containing an icon and a caption.
    Add to Wishlist
    Download
    AI Customize
    Diagram illustrating the habit loop with three stageconnected by arrows in a circular flow, with placeholders text.
    Add to Wishlist
    Download
    AI Customize
    Circular loop slide illustrating four different components with percentage contributions and placeholder text.
    Add to Wishlist
    Download
    AI Customize
    Causal loop diagram slide illustrating factors influencing business activity and commercial space availability.
    Add to Wishlist
    Download
    AI Customize
    Colorful circular diagram with four arrows in teal, red, purple, and blue, each labeled with numbers.
    Add to Wishlist
    Download
    AI Customize
    Retail-themed slide with a central shopping icon surrounded by circular icons representing retail concepts.
    Add to Wishlist
    Download
    AI Customize
    Causal diagram on deforestation with interconnected loops, arrows, and orange circular feedback icons.
    Free
    Add to Wishlist
    Download
    AI Customize
    Green circular flowchart with five white icons, each connected to text boxes on the sides by arrows.
    Free
    Add to Wishlist
    Download
    AI Customize
    Circular diagram in shades of purple with six segments, each numbered and pointing to text boxes.
    Add to Wishlist
    Download
    AI Customize
    Circular project flow diagram with five stages displayed in colorful segments and arranged around a central icon.
    Add to Wishlist
    Download
    AI Customize
    Customizable Causal Loop Diagram PowerPoint Slide
    Add to Wishlist
    Download
    AI Customize
    Circular infographic design with four green icons representing business, goals, growth, and finance, arranged around arrows.
    Add to Wishlist
    Download
    AI Customize
    Colorful circular infographic with eight sections, each with an icon and text area, forming a closed loop layout.
    Add to Wishlist
    Download
    AI Customize
    Circular infographic with interconnected orange and navy rings around a briefcase icon, each containing text.
    Add to Wishlist
    Download
    AI Customize
    Circular infographic PPT Google Slides with five color coded sections and business related icons with placeholder text.
    Add to Wishlist
    Download
    AI Customize
    Purple themed marketing communication template featuring an atomic structure with six numbered points and text boxes.
    Add to Wishlist
    Download
    AI Customize
    A causal loop diagram illustrating factors affecting deforestation, including many elements.
    Add to Wishlist
    Download
    AI Customize
    Effective Presentation Template For Strategy Design
    Add to Wishlist
    Download
    AI Customize
    A loop diagram PPT slide with four colored arrows representing a cycle, with labeled captions for each segment.