Circle Infographic PowerPoint Templates and Google Slides


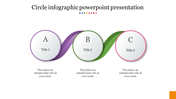
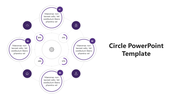
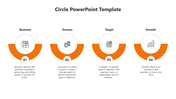
Multicolor Circle Infographic PowerPoint Template and Google Slides
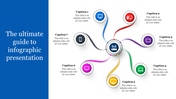
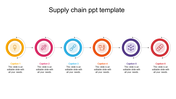
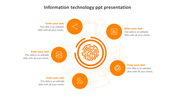
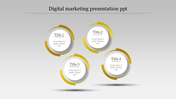
This "Multicolor Circle Infographic PowerPoint Template and Google Slides" is a great tool for clearly and concisely visualizing data. The circular design helps you display a variety of related information around a central idea. This template has six separate colorful sections, each of which can be used to highlight your important data points or information.
Key Features and How to Use:
- Clear Visualization: Circle charts are very effective when displayed in an easy-to-understand way. They are great for showing related data or a continuous process.
- Colorful and Attractive Design: Using different colors helps to differentiate information, attract, and hold the attention of the audience.
- Customizable Sections: You can add titles and brief descriptions to each section. You can adjust the number and size of sections to suit your needs.
- Various Uses: You can use it for various purposes such as business reports, marketing presentations, educational information, statistical analysis, and process diagrams.
- How to use: You can open this template in PowerPoint or Google Slides and enter your data in each section. You can further clarify your chart by adding text, numbers, and icons.
Features of the template
- 100% customizable slides and easy to download.
- Slides are available in different nodes & colors.
- The slides contain 16:9 and 4:3 formats.
- Easy to change the colors quickly.
- It is a well-crafted template with an instant download facility.
- It is a 100% pre-designed slide.
- This slide is compatible with Google Slide Themes.
- It has a colorful visual diagram.


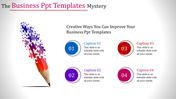
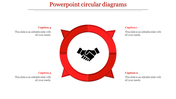
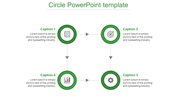
You May Also Like These PowerPoint Templates
Add to Wishlist
Download
AI Customize

Add to Wishlist
Download
AI Customize

Add to Wishlist
Download
AI Customize

Add to Wishlist
Download
AI Customize

Add to Wishlist
Download
AI Customize

Add to Wishlist
Download
AI Customize

Add to Wishlist
Download
AI Customize

Add to Wishlist
Download
AI Customize

Add to Wishlist
Download
AI Customize

Add to Wishlist
Download
AI Customize

Add to Wishlist
Download
AI Customize

Add to Wishlist
Download
AI Customize

Add to Wishlist
Download
AI Customize

Add to Wishlist
Download
AI Customize

Add to Wishlist
Download
AI Customize

Add to Wishlist
Download
AI Customize

Add to Wishlist
Download
AI Customize

Add to Wishlist
Download
AI Customize

Add to Wishlist
Download
AI Customize

Add to Wishlist
Download
AI Customize
