Multicolor 3D Circle Diagram PowerPoint Design Template

Colorful circular infographic slide with four sections representing business, target, growth, and profit with icons.
P.ID : 10535
    779 views
    70 Downloads
    Get Custom Slides by Experts
    Instantly Access Templates in PowerPoint

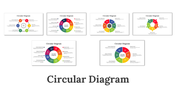
    3D Circle Infographic PowerPoint Template Design


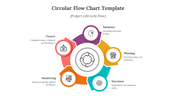
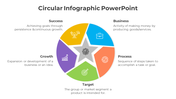
    The 3d circle diagram PowerPoint Slide is one of the best tools out there when it comes to brainstorming different ways to present data and images to your audience. If you're looking to create 3d drawings, this is an excellent option for your projects. With a 3d diagram tool, it is easy to make detailed drawings and diagrams on virtually any subject. So grab it!!


    About the Template:


    The 3d circle diagram PowerPoint Slide is a multicolor infographic design template. You can also personalize the template setup like color, theme, background, and design as per your desire. This circle diagram PowerPoint template will help you generate a fantastic effect. In addition, it is designed using beautiful icons to visualize your ideas.


    Features of this template:


    • 100 % customizable slides and easy to download. 
    • Slides are available in different nodes & colors.
    • The slide contained in 16:9 and 4:3 format.
    • Easy to change the slide colors quickly.
    • It is a well-crafted template with an instant download facility.
    • The best PowerPoint theme template.

    Advertisement

    You May Also Like These PowerPoint Templates

    Add to Wishlist
    Download
    AI Customize
    3D segmented sphere with colorful sections and labeled captions describing its features in a white backdrop.
    Free
    Add to Wishlist
    Download
    AI Customize
    Three-layered 3D pyramid infographic with labeled sections highlighting business description, direction, and vision.
    Free
    Add to Wishlist
    Download
    AI Customize
    3D pie chart template with four colored sections labeled with percentages and icons, each linked to placeholder text.
    Add to Wishlist
    Download
    AI Customize
    Marketing strategy template showcasing five key steps in a circular format with icons and descriptive text.
    Add to Wishlist
    Download
    AI Customize
    Customizable Deforestation Causal Loop Diagram PowerPoint
    Free
    Add to Wishlist
    Download
    AI Customize
    Central circle with a bar chart surrounded by six orange hexagons with icons representing different elements.
    Free
    Add to Wishlist
    Download
    AI Customize
    Cycle diagram featuring six red sections arranged in a circular shape with arrows, each labeled with captions areas.
    Add to Wishlist
    Download
    AI Customize
    Business ecosystem slide with a circular flow chart showing technology related color coded icons on a white backdrop.
    Add to Wishlist
    Download
    AI Customize
    Deforestation slide with interconnected orange arrows, text nodes, and green elements inside a blue border.
    Add to Wishlist
    Download
    AI Customize
    Visual representation of a causal loop diagram focusing on irrigation management, with key loops.
    Add to Wishlist
    Download
    AI Customize
    Circular flow diagram of economics slide showing interactions between four colored sections on a white backdrop.
    Add to Wishlist
    Download
    AI Customize
    Six-segment semi-circle diagram with central star icon and various colored icons, each section labeled with captions areas.
    Free
    Add to Wishlist
    Download
    AI Customize
    Hexagonal red circle infographic with six sections, each containing an icon and a caption.
    Add to Wishlist
    Download
    AI Customize
    Diagram illustrating the habit loop with three stageconnected by arrows in a circular flow, with placeholders text.
    Add to Wishlist
    Download
    AI Customize
    Circular loop slide illustrating four different components with percentage contributions and placeholder text.
    Add to Wishlist
    Download
    AI Customize
    Causal loop diagram slide illustrating factors influencing business activity and commercial space availability.
    Add to Wishlist
    Download
    AI Customize
    Colorful circular diagram with four arrows in teal, red, purple, and blue, each labeled with numbers.
    Free
    Add to Wishlist
    Download
    AI Customize
    Interconnected blue circular infographic highlighting SWOT categories with icons and text labels.
    Add to Wishlist
    Download
    AI Customize
    SOP steps in a circular arrangement with colorful icons and labels from update to publish around the central text.