Stunning China Map PowerPoint Template Presentation

China map slide with regions color coded and percentage sliders showing data points with placeholder text.
P.ID : 49183
    250 views
    34 Downloads
    Get Custom Slides by Experts
    Instantly Access Templates in PowerPoint

    China Map Template 

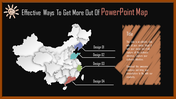
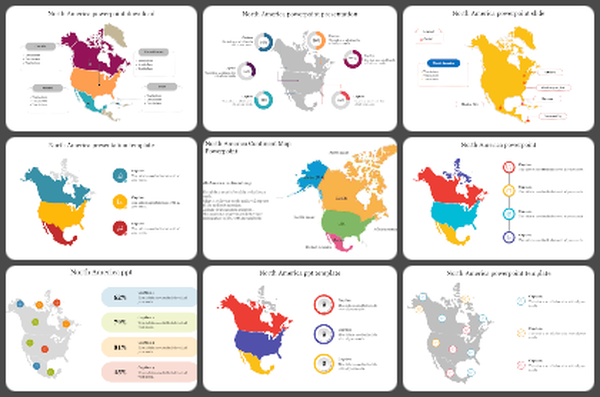
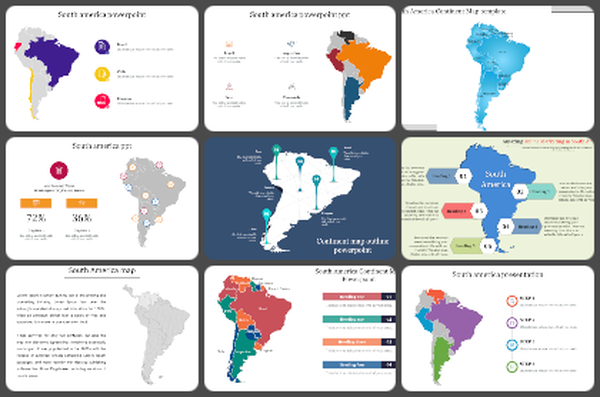
    China is a country located in East Asia and has a land area of approximately 9.6 million square kilometers. It shares borders with 14 countries and is the world's most populous country with over 1.4 billion people. The country is divided into 23 provinces, five autonomous regions, four municipalities, and two special administrative regions. China map infographics are visual representations that convey information related to China's geography, demography, economy, culture, and history.  it has wide range of uses, including educational, business, tourism, news media, and research purposes. In the education sector, this template can be used to teach students about China's geography and culture.

    Features of the template

    • 100% customizable slides and easy to download.
    • The slide contained 16:9 and 4:3 formats.
    • Well-crafted template with instant download facility.
    • Editable China map outline included.
    • Spacious node and text dimension.
    Advertisement

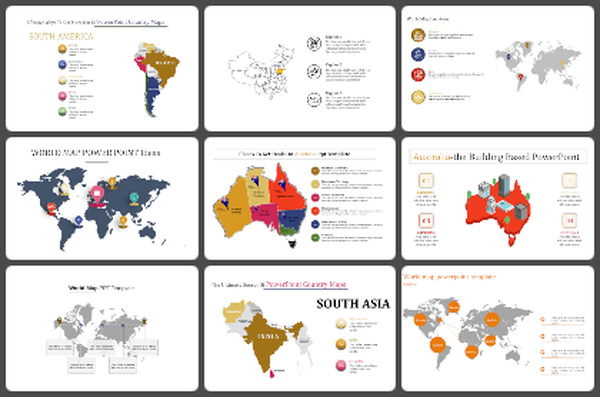
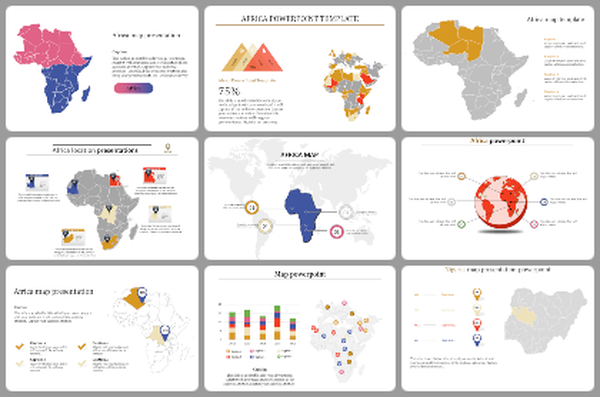
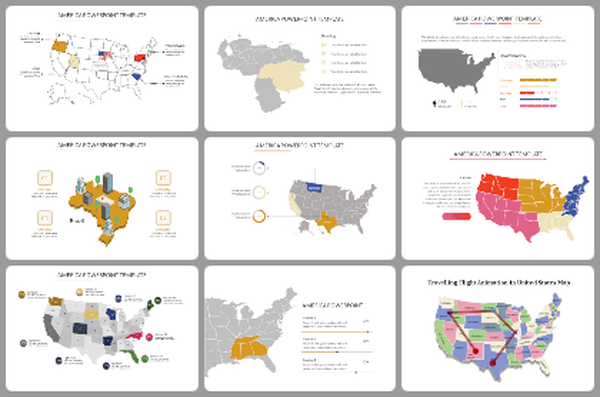
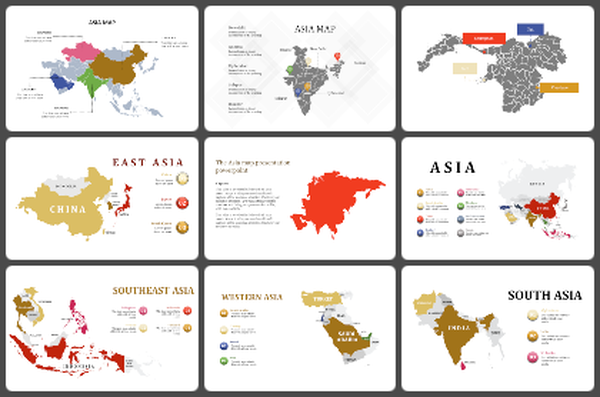
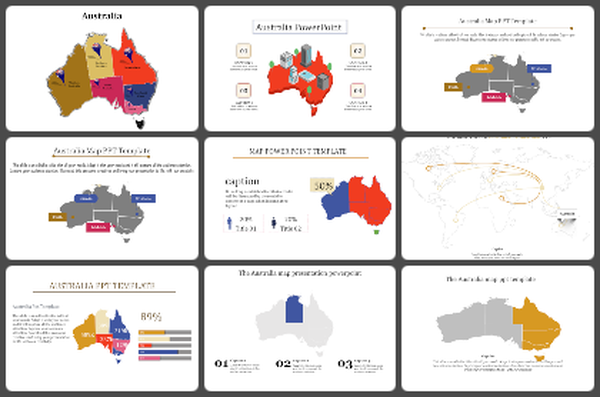
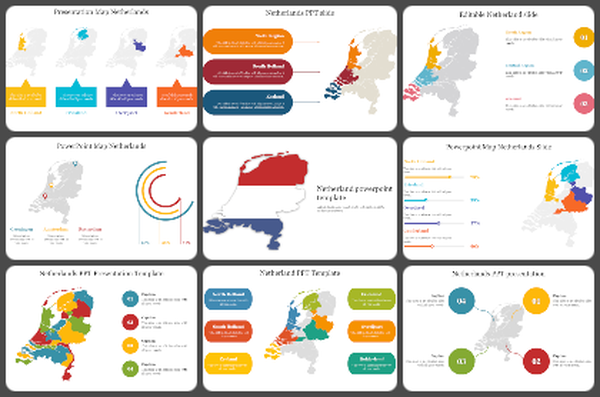
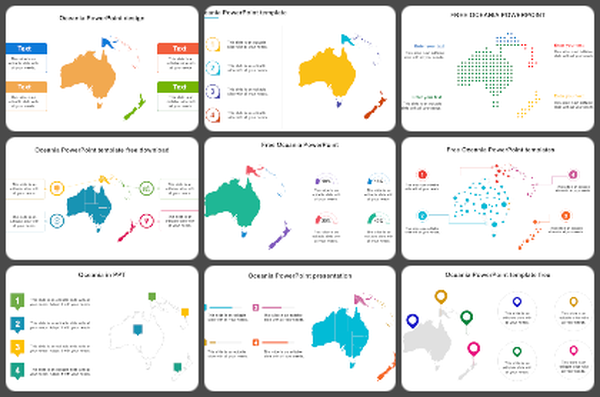
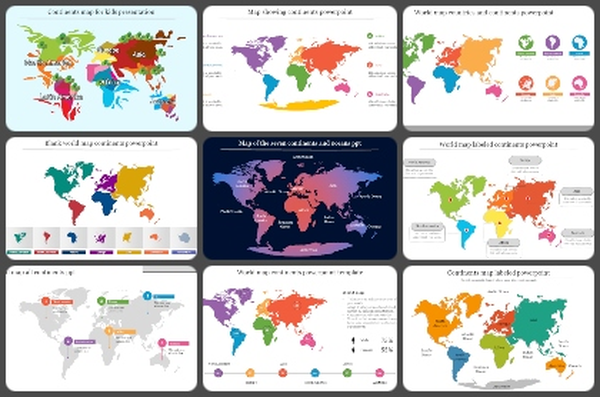
    You May Also Like These PowerPoint Templates

    Free
    Add to Wishlist
    Download
    AI Customize
    Attractive Portugal Map PPT Slide Presentation
    Add to Wishlist
    Download
    AI Customize
    Argentina map PowerPoint slide with colorful text boxes for adding regional information.
    Add to Wishlist
    Download
    AI Customize
    Map of Japan with pink travel route markers with planes and pins, and four numbered labels on the left.
    Add to Wishlist
    Download
    AI Customize
    PowerPoint template featuring a map of Sweden with four highlighted areas in different colors with captions.
    Add to Wishlist
    Download
    AI Customize
    Color-coded world map with circular percentage indicators for each continent, set against a dark background.
    Add to Wishlist
    Download
    AI Customize
    Gray world map with Belize highlighted by a red pin in Central America and a close-up red shape of Belize on the right.
    Add to Wishlist
    Download
    AI Customize
    Portugal map infographic with colored regions and labeled caption areas, for presentations.
    Free
    Add to Wishlist
    Download
    AI Customize
    Map of Switzerland displaying regions in different colors, labeled Graubünden, Valais, Vaud, Luzern, Jura, and Zurich.
    Add to Wishlist
    Download
    AI Customize
    India map slide highlighting the states in different colors.
    Add to Wishlist
    Download
    AI Customize
    Minnesota state map highlighting key counties with four labels each with brief descriptions.
    Add to Wishlist
    Download
    AI Customize
    Gray Tokyo map with three colorful fan icons pointing to text areas on a white background.
    Add to Wishlist
    Download
    AI Customize
    Comoros map template featuring labeled regions with icons in colored boxes on a gray background.
    Add to Wishlist
    Download
    AI Customize
    Blank Map of Continents and Oceans PowerPoint
    Add to Wishlist
    Download
    AI Customize
    Indonesia map presentation slide with colorful percentage icons and data with placeholder text.
    Add to Wishlist
    Download
    AI Customize
    Gray Singapore map with five highlighted regions, and location details on the right with flag in the left corner.
    Add to Wishlist
    Download
    AI Customize
    Effective Paris Template PPT Free Slide With Two Nodes
    Free
    Add to Wishlist
    Download
    AI Customize
    A dotted circle with a Cuba map in the center, surrounded by blue, purple, orange, and red text boxes connected by lines.
    Add to Wishlist
    Download
    AI Customize
    China map slide with four colored regions highlighted, each accompanied by a caption on the left with icons.
    Add to Wishlist
    Download
    AI Customize
    Map of China with highlighted data locations and associated figures, complemented by percentage icons on the right.