Elegant Chart Presentation Template Slides Designs

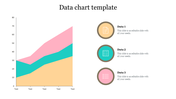
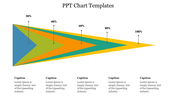
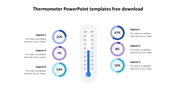
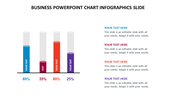
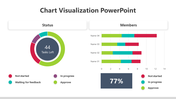
Chart Presentation Template
Engage your audience from the first slide with our Chart Presentation Template, designed to make data visualization both striking and comprehensible.
Slide Description:
Our template displays a chart presentation template. It showcases website traffic data for a specific period (from 01.01.2020 to 31.01.2020). It is divided into three main sections: Organic Sessions: Displays a session count of 350,300 with a percentage change of +52%. Goals (Organic): Indicates 20,010 goal completions with a percentage change of -31%. Goal Conversion Rate: Presents a conversion rate of 12% with an increase indicator of +34%. Each section includes a line graph illustrating the trend over time. Icons represent different devices that generated organic traffic: Desktop Monitor: 50,000 sessions (+25% change) Tablet: 15,000 sessions (-31% change) Smartphone: 10,000 sessions (+4% change)
Who can benefit?
Digital Marketers: Analyze website performance and trends. SEO Specialists: Optimize organic reach. Web Analytics Teams: Make informed decisions based on KPIs.
Download now!
Features of the template:
- Slides are available in 4:3 & 16:9
- Get slides that are 100% customizable and easy to download
- Highly compatible with PowerPoint and Google Slides


You May Also Like These PowerPoint Templates
Add to Wishlist
Download
Edit

Add to Wishlist
Download

Add to Wishlist
Download
Edit


Add to Wishlist
Download
Edit

Add to Wishlist
Download
Edit

Add to Wishlist
Download
Edit

Add to Wishlist
Download
Edit

Add to Wishlist
Download
Edit


Add to Wishlist
Download
Edit


Add to Wishlist
Download
Edit


Add to Wishlist
Download
Edit


Add to Wishlist
Download
Edit

Add to Wishlist
Download
Edit


Add to Wishlist
Download
Edit
