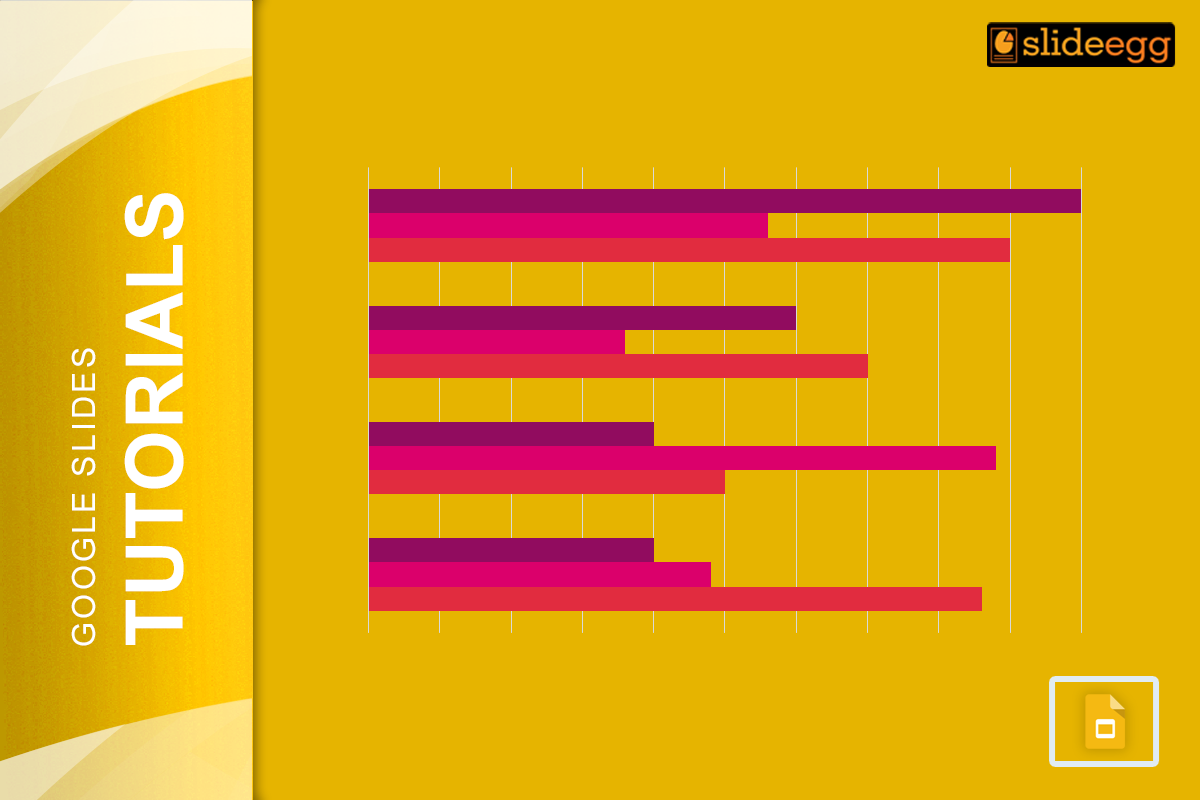
Bar charts are a great way to visualize data and make your presentations more engaging. When you add years to a bar chart, it becomes even more meaningful, especially for showing trends over time. Google Slides makes it super easy to create stunning bar charts. Here’s a step-by-step guide to help you add years to your bar chart in Google Slides.
Step 1: Insert a Bar Chart
- Open Google Slides: Head to your presentation or start a new one.
- Go to the “Insert” Menu: In the top toolbar, click on “Insert”.
- Select “Chart” and Choose “Bar”: This will insert a basic bar chart into your slide.
That’s it! You now have a bar chart ready to customize.
Step 2: Edit the Data Table
- Click on the Chart: A small menu will pop up. Click the pencil icon or “Open Source” to edit the chart data.
- Add Your Years in the First Column: Open the spreadsheet that comes with your chart. Replace the default labels with your years (e.g., 2024, 2025, 2026).
- Input Data for Each Year: In the other columns, add the values you want to display for those years.
Step 3: Customize the Bar Chart
To make your chart look great:
- Change the Colors: Click on the bars to select them, and then use the toolbar to pick colors that match your presentation theme.
- Adjust the Text: Edit the title to reflect your data (e.g., “Yearly Sales Data”). You can also resize or change the font for better readability.
- Format the Axis: Ensure the years on the x-axis are clear and easy to read.
Step 4: Export and Present
Once your chart is ready:
- Click “Present”: This will showcase your slide in full-screen mode.
- Share or Download: Google Slides lets you share your presentation or download it as a PDF or PowerPoint.
Pro Tip: If you’re working with a team, share the Google Slides link so everyone can edit or view it in real-time.
Need a Head Start?
Don’t have time to create everything from scratch? Use Free Google Slides to speed up your workflow. These templates often come with pre-designed charts, saving you tons of time while keeping your slides polished.
Why Adding Years Makes Bar Charts Powerful
Using years as labels on your bar chart is one of the best ways to show trends over time. It can help highlight growth, compare performance across different years, or even track patterns like seasonal changes. Plus, a well-designed chart can impress your audience!
If you’re looking for even more tips on creating visuals, check out our guide on “How to Make Charts in Google Slides“. It covers everything from pie charts to line graphs, so you can explore all your options.
Final Thoughts
Adding years to a bar chart in Google Slides is a simple yet powerful way to tell a story with your data. Whether it’s for business, education, or personal use, following these steps will ensure your presentation stands out. Happy chart-making!