Editable 70 20 10 Learning And Development Approach Slide

Graphic illustrating the 70 20 10 learning and development approach with three colored sections with icons and text area.
P.ID : 60947
    30 slides
    70, 20, 10 model slide deck with colorful charts, diagrams, and infographics for learning and development strategies.
    13 slides
    Slide pack featuring a 70-20-10 model, with flow diagrams, circular charts, and infographics in vibrant colors.
    13 slides
    70-20-10 Approach To Learning PPT And Google Slides Themes
    382 views
    42 Downloads
    Get Custom Slides by Experts
    Instantly Access Templates in PowerPoint

    Effective 70 20 10 Learning Plan PowerPoint Template. 

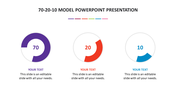
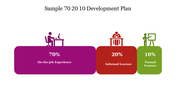
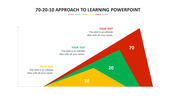
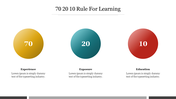
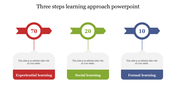
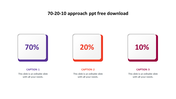
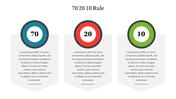
    Would you like to present your high-level priorities and Learn innovatively to your audience? Our 70 20 10 Learning And Development Approach PowerPoint Template will help you achieve your goal. This template will assist you in analyzing the current Learning process. This 70 20 10 plan ppt template is mainly used in a business meeting or company sale meeting. Also, The three icons designs of this 70 20 10 Learning And Development Approach PowerPoint Template help increase the audience's interest. In addition, this template has three types of text areas to add your information. It is a pre-built slide with all the essential elements. You can edit the icon colors and text in this template. We also have a wide range of  70 20 10 Learning Report PPT slides.

    Features of this template

    • This template is 100% editable.
    • 100% Customizable (shape color, size & text)
    • This template has a blue theme.
    • Drag and drop image placeholder
    • Huge Collections of Learning slides to impress your audience
    • It supports an aspect ratio of 16:9. 
    • Easily readable and acceptable template.
    Advertisement

    You May Also Like These PowerPoint Templates

    Add to Wishlist
    Download
    AI Customize
    Graphic illustrating the 70 20 10 learning and development approach with three colored sections with icons and text area.
    Free
    Add to Wishlist
    Download
    AI Customize
    Color coded circles in yellow, blue, and orange with numbers 70, 20, and 10 above corresponding learning categories.
    Add to Wishlist
    Download
    AI Customize
    Slide deck displaying the 70 20 10 development plan with three colorful shapes in orange, green, and red.
    Add to Wishlist
    Download
    AI Customize
    Slide deck with multiple 70 20 10 model layouts, illustrating career development with vibrant colors and diverse icons.
    Add to Wishlist
    Download
    AI Customize
    70 20 10 framework illustrated with increasing realized value from formal to experiential learning in a triangular shape.
    Add to Wishlist
    Download
    AI Customize
    Slide with three concentric circle diagrams in orange, blue, and purple, representing percentage splits, with captions below.
    Add to Wishlist
    Download
    AI Customize
    Three pie charts showing 70, 20, 10 learning approach, with green and red sections labeled with percentages and captions.
    Add to Wishlist
    Download
    AI Customize
    Infographic representing the 70-20-10 learning model with red, green, and yellow sections labeled with caption areas.
    Add to Wishlist
    Download
    AI Customize
    Visual representation of the 70 20 10 model, emphasizing learning types with distinct colors and minimalistic icons.
    Add to Wishlist
    Download
    AI Customize
    Buy 70 20 10 Model PowerPoint Template Presentation
    Add to Wishlist
    Download
    AI Customize
    A stepped layout with three diagonal sections in red, green, and blue, each with a circular marker displaying 10, 20, and 70.
    Add to Wishlist
    Download
    AI Customize
    Best 70 20 10 Learning Model PowerPoint Slide
    Add to Wishlist
    Download
    AI Customize
    Colorful spiral diagram with concentric circles in red, blue, and yellow, along with horizontal bars indicating percentage.
    Add to Wishlist
    Download
    AI Customize
    70 20 10 model PPT slide with color coded sections for Experiential, Social, and Formal learning with percentages and text.
    Add to Wishlist
    Download
    AI Customize
    Three green stacked bars in increasing height, aligned left to right, representing percentages on top.
    Add to Wishlist
    Download
    AI Customize
    Slide showing the 70 20 10 approach with 3 percentage circles for learning distribution with captions on a white backdrop.