Use 70-20-10 Approach To Learning Template Model

Infographic representing the 70-20-10 learning model with red, green, and yellow sections labeled with caption areas.
P.ID : 52846
    30 slides
    70, 20, 10 model slide deck with colorful charts, diagrams, and infographics for learning and development strategies.
    13 slides
    Slide pack featuring a 70-20-10 model, with flow diagrams, circular charts, and infographics in vibrant colors.
    13 slides
    70-20-10 Approach To Learning PPT And Google Slides Themes
    156 views
    15 Downloads
    Get Custom Slides by Experts
    Instantly Access Templates in PowerPoint

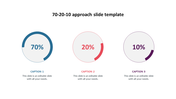
    70-20-10 Approach PowerPoint Slide

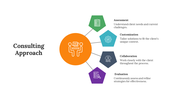
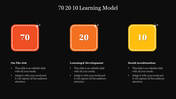
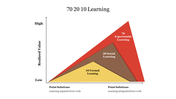
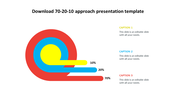
    The 70-20-10 approach to learning is a widely used framework that helps organizations design and deliver effective learning and development programs. The approach suggests that individuals learn best through a combination of on-the-job experience (70%), social interactions (20%), and formal training (10%). It acknowledges that most of what people learn happens through practical experience and interactions with others. Our slide lends a helping hand to display the overview of the framework and how they can incorporate it into their learning and development initiatives. Also, highlights the importance of each element of the approach.


    Features of the template

    • 100% customizable slides and easy to download.
    • Slides are available in different nodes & colors.
    • The slide contains 16:9 and 4:3 formats.
    • Easy to change the slide colors quickly.
    • Well-crafted template with an instant download facility. 
    • Access on both MS PowerPoint and Google Slides.
    • Three nodes are added.
    • Ring-themed node setup.
    Advertisement

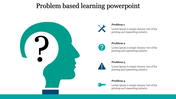
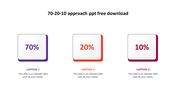
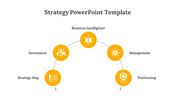
    You May Also Like These PowerPoint Templates

    Add to Wishlist
    Download
    AI Customize
    Infographic showing the 70 20 10 rule for learning, with experience, exposure, and education with colored circles.
    Add to Wishlist
    Download
    AI Customize
    Three steps learning approach slide illustrates experiential learning, social learning, and formal learning with text boxes.
    Free
    Add to Wishlist
    Download
    AI Customize
    Our Predesigned 70-20-10 Approach PPT Free Download
    Add to Wishlist
    Download
    AI Customize
    Three panel layout for the 70, 20, 10 rule with numbered circles in blue, red, and green atop text boxes.
    Add to Wishlist
    Download
    AI Customize
    Graphic illustrating the 70 20 10 learning and development approach with three colored sections with icons and text area.
    Free
    Add to Wishlist
    Download
    AI Customize
    Color coded circles in yellow, blue, and orange with numbers 70, 20, and 10 above corresponding learning categories.
    Add to Wishlist
    Download
    AI Customize
    Slide deck displaying the 70 20 10 development plan with three colorful shapes in orange, green, and red.
    Add to Wishlist
    Download
    AI Customize
    Slide deck with multiple 70 20 10 model layouts, illustrating career development with vibrant colors and diverse icons.
    Add to Wishlist
    Download
    AI Customize
    70 20 10 framework illustrated with increasing realized value from formal to experiential learning in a triangular shape.
    Add to Wishlist
    Download
    AI Customize
    Slide with three concentric circle diagrams in orange, blue, and purple, representing percentage splits, with captions below.
    Add to Wishlist
    Download
    AI Customize
    Three pie charts showing 70, 20, 10 learning approach, with green and red sections labeled with percentages and captions.
    Add to Wishlist
    Download
    AI Customize
    Infographic representing the 70-20-10 learning model with red, green, and yellow sections labeled with caption areas.
    Add to Wishlist
    Download
    AI Customize
    Visual representation of the 70 20 10 model, emphasizing learning types with distinct colors and minimalistic icons.
    Add to Wishlist
    Download
    AI Customize
    Buy 70 20 10 Model PowerPoint Template Presentation
    Add to Wishlist
    Download
    AI Customize
    A stepped layout with three diagonal sections in red, green, and blue, each with a circular marker displaying 10, 20, and 70.
    Add to Wishlist
    Download
    AI Customize
    Best 70 20 10 Learning Model PowerPoint Slide
    Add to Wishlist
    Download
    AI Customize
    Colorful spiral diagram with concentric circles in red, blue, and yellow, along with horizontal bars indicating percentage.