Creative See Saw Shape PowerPoint Presentation Template

Slide featuring a visual representation of a seesaw with icons indicating upward and downward movement with captions.
P.ID : 61427
    11 slides
    Leadership Vs Management PPT Template and Google Slides
    11 slides
    Internal vs external audit slide with red and teal sections for the characteristic differences between both audit types.
    11 slides
    Android mobile vs. Apple mobile slides featuring logos of both platforms in different layout designs and icons with text.
    21 slides
    Comparison slide deck featuring different visual formats like arrows, charts, and hexagons to compare two products.
    422 views
    67 Downloads
    Get Custom Slides by Experts
    Instantly Access Templates in PowerPoint

    Effective See-saw PPT Template


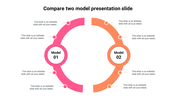
    The Saw Shape template is practical with two nodes designed with two arrows PPT. The template is creative and functional, with colorful nodes that can bring all the necessary details. You will add text in the given text area that can make the audience understand the topic effectively.


    You will show the ups and downs of a business using this template. You will be able to edit this fully customized template and make it even neater. Make sure to impress your audience using this effective template.


    The template can be added with user-friendly features and can attract an audience. Make sure to download this explicit template and gain the audience's attention. Grab now!.


    Features of this Template:

    • Easy to change the slide colors quickly.
    • Well-crafted template with instant download facility.
    • 100% customizable slides and easy to download.
    • Slides are given in different nodes & colors.
    • The template is designed in 16:9 and 4:3 format.
    • Two arrows with a see-saw design.
    Advertisement

    You May Also Like These PowerPoint Templates

    Add to Wishlist
    Download
    AI Customize
    A slide with a comparison chart featuring two designs, each with steps and bar graphs in orange, red, blue, green and purple.
    Add to Wishlist
    Download
    AI Customize
    Two rounded rectangles in teal and red with icons and text, arranged side by side, on a white background.
    Add to Wishlist
    Download
    AI Customize
    Comparison slide featuring red and blue hexagons on either side, with seven numbered nodes connected by lines.
    Add to Wishlist
    Download
    AI Customize
    Force Field Analysis PowerPoint Presentation Diagram
    Add to Wishlist
    Download
    AI Customize
    Comparison slide showing a bar chart with Generation X and Generation Z percentages, along with illustrated characters.
    Add to Wishlist
    Download
    AI Customize
    Gender symbols chart slide with two sections displaying groups of male and female icons, each with percentage markers.
    Free
    Add to Wishlist
    Download
    AI Customize
    Top Notch Comparison Bar Graph PowerPoint Presentation
    Add to Wishlist
    Download
    AI Customize
    A slide showing two gauge meters, one labeled good in green and the other bad in red, indicating performance levels.
    Add to Wishlist
    Download
    AI Customize
    Table comparing GSM and CDMA technologies with key differences on a blue background.
    Add to Wishlist
    Download
    AI Customize
    Comparison layout with orange and red header boxes labeled with online and normal shopping, separated by a blue Vs circle.
    Add to Wishlist
    Download
    AI Customize
    Comparison slide with an orange and red vertical bar featuring a grid with gray text boxes separated by colored headers.
    Add to Wishlist
    Download
    AI Customize
    Comparison chart slide showing the differences between a leader and a supervisor, with icons and bullet points for each role.
    Add to Wishlist
    Download
    AI Customize
    A superlative slide showing three individuals, with labels from short to shortest with placeholder text.
    Add to Wishlist
    Download
    AI Customize
    Two column competitor chart showing varying percentage comparisons with multicolored bars for each row.
    Add to Wishlist
    Download
    AI Customize
    A series of four colorful gears in yellow, red, green, and blue, each labeled with a percentage and numbered captions.
    Add to Wishlist
    Download
    AI Customize
    Two side by side images of engineers with performance, punctuality, and overtime bars in green and blue below each.