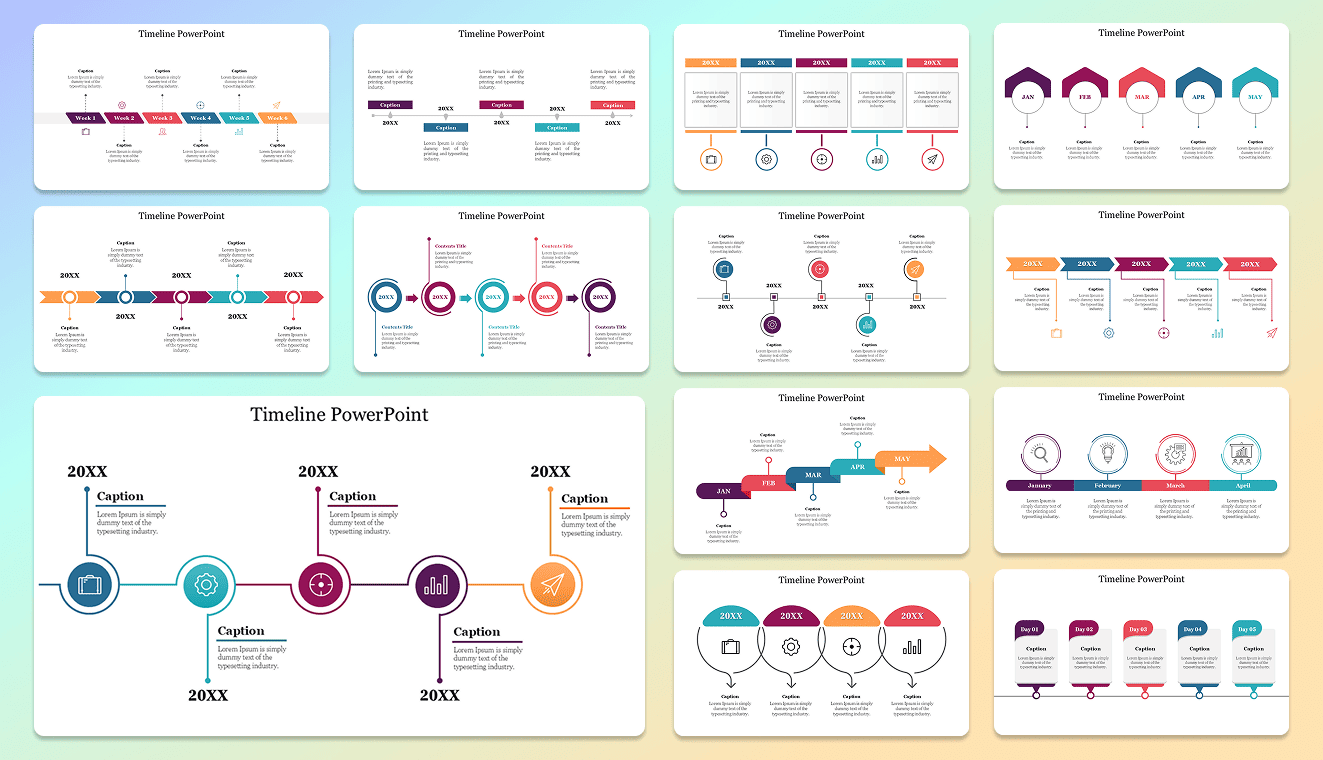
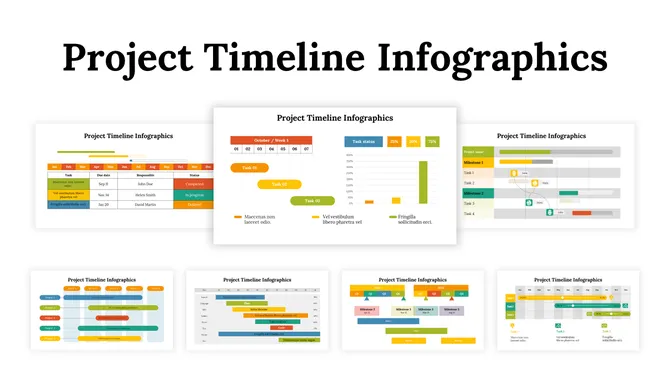
4,900+ Free Timeline PowerPoint Templates
Browse 4,900+ free and premium timeline templates for PowerPoint, Google Slides, and Canva. Fully editable designs for project plans, business milestones, product roadmaps, event schedules, historical timelines, and academic presentations. Customize colors, fonts, icons, and layouts in minutes. Free to download.
Editor's Choice (1 of5)


Why Timeline Templates Are the Fastest Way to Organize Any Presentation
What Is a Timeline Template?
Who Uses Timeline Templates?
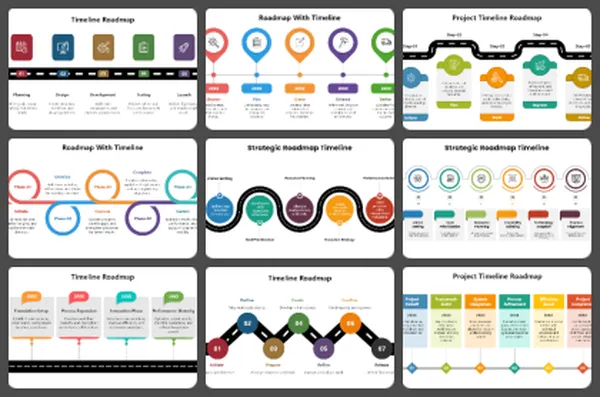
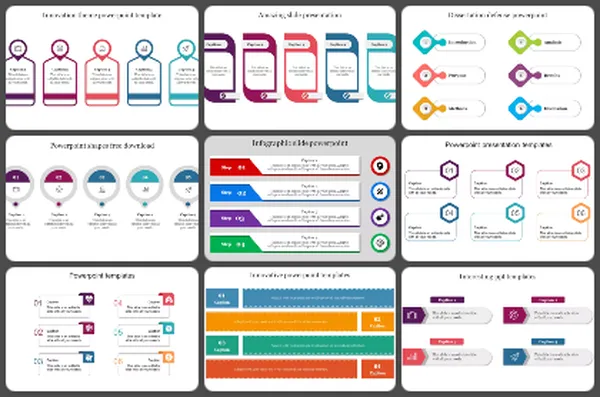
Types of Timeline Templates Available
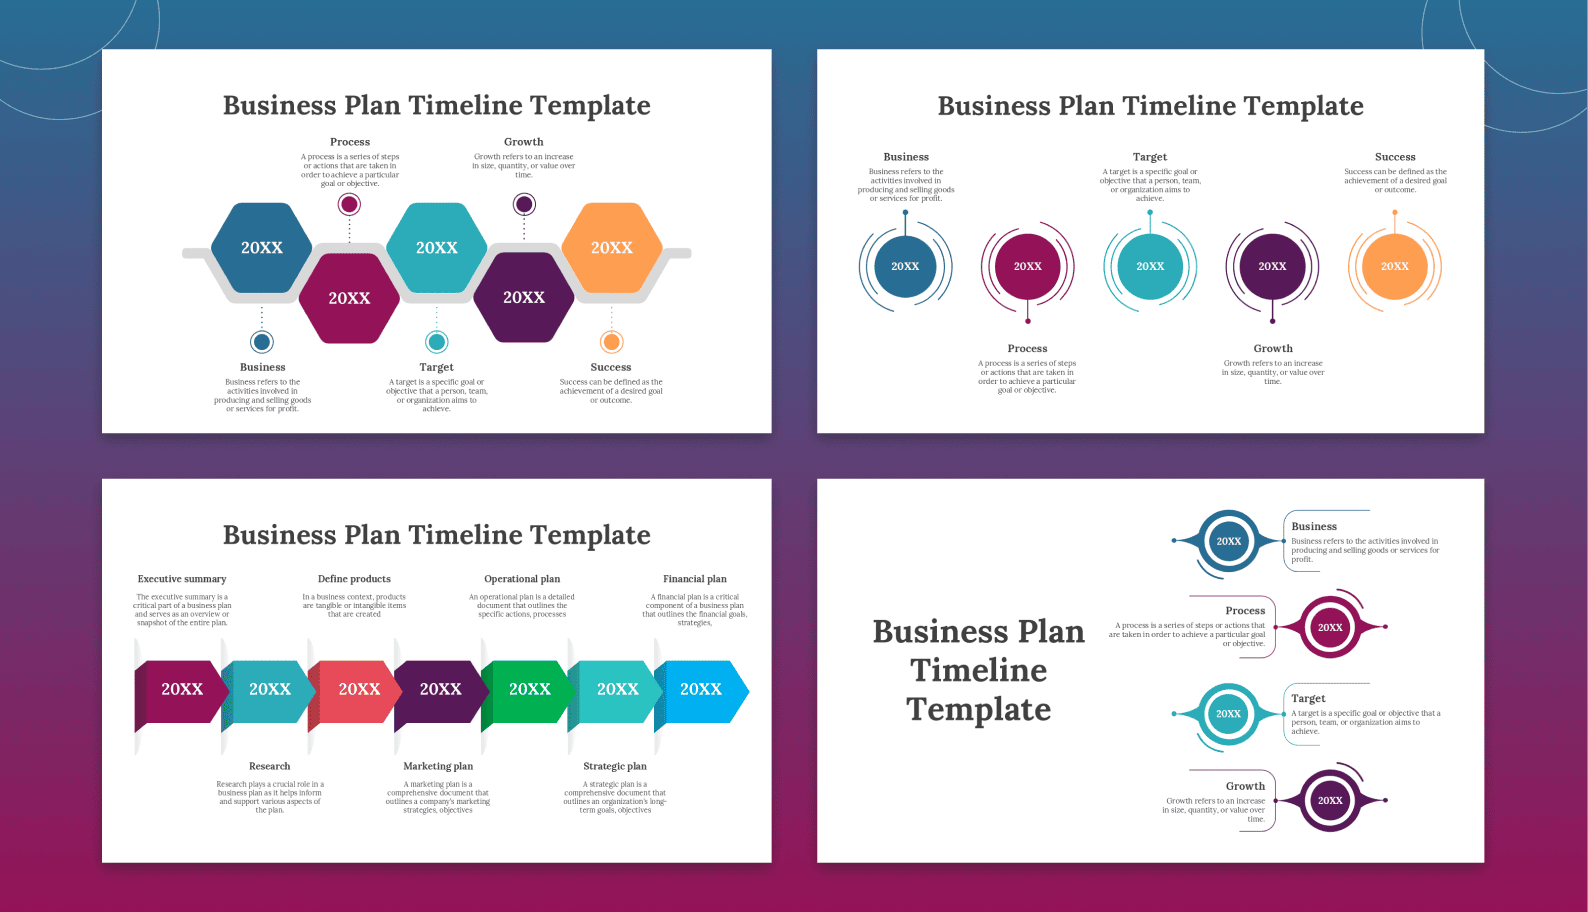
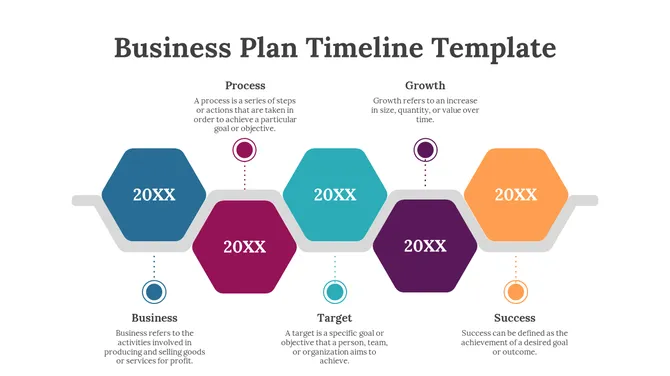
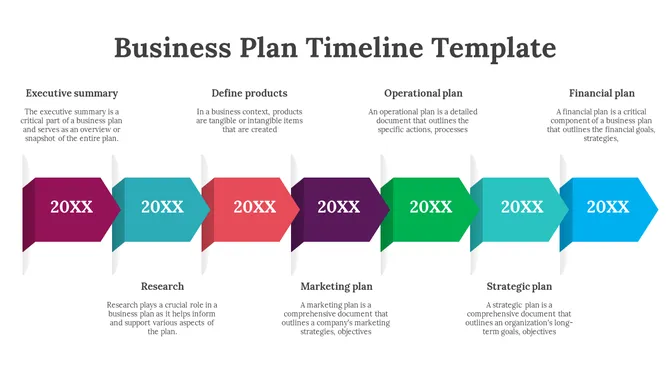
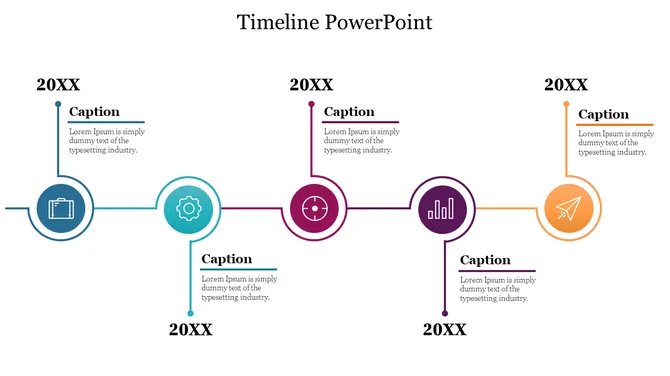
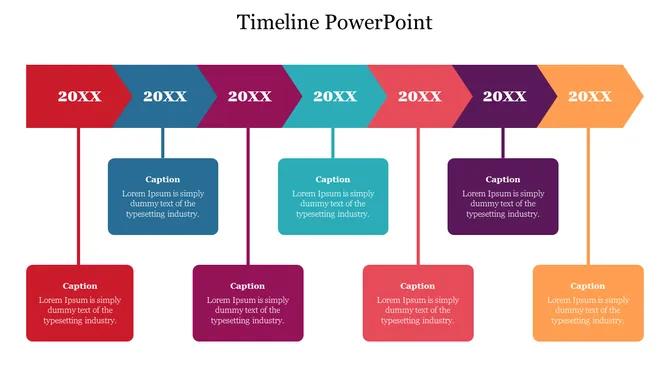
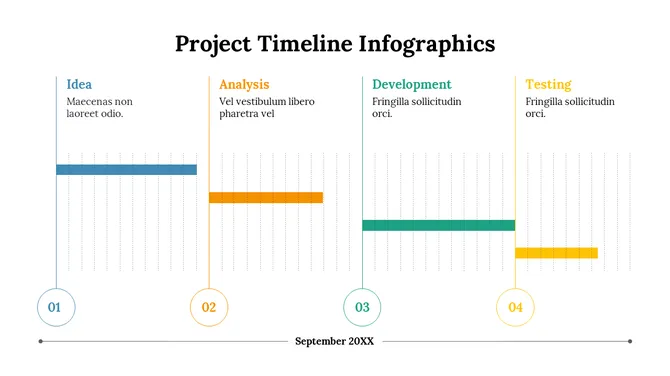
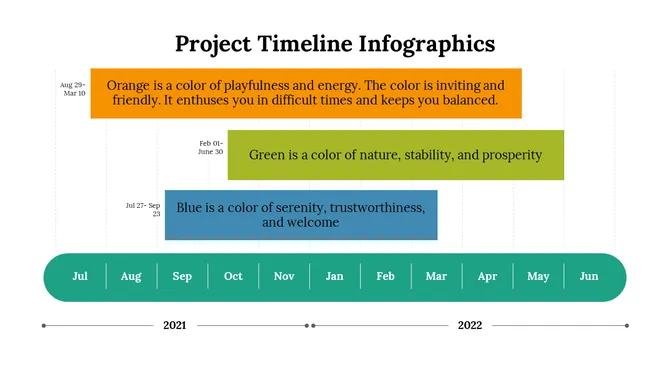
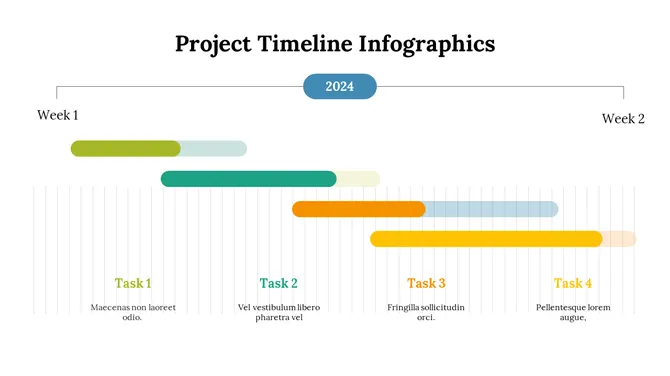
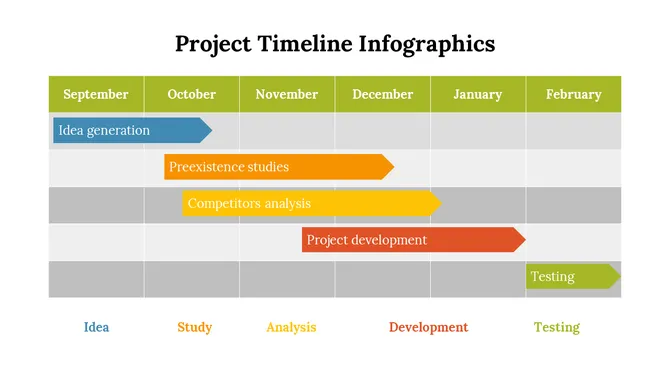
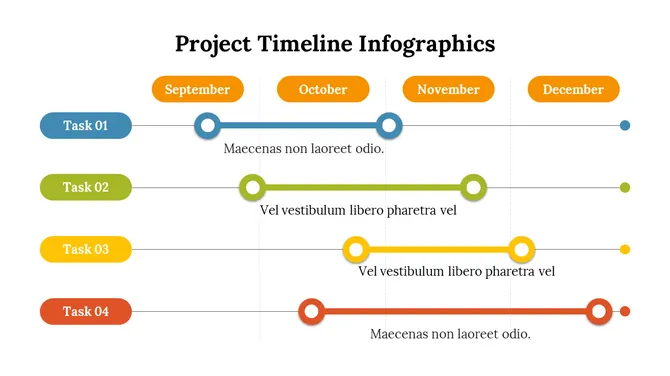
- Horizontal Timeline Templates: The most common format. Events are placed left to right in chronological order, making it easy to show progress over time. Ideal for project plans, product launches, and business milestones.
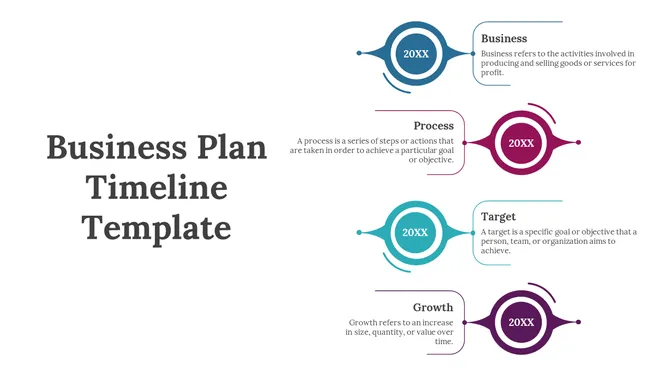
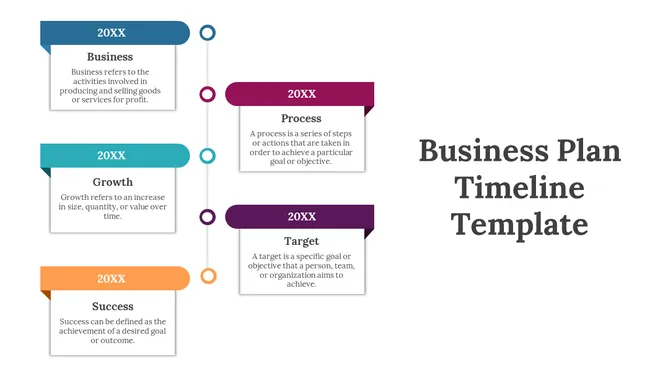
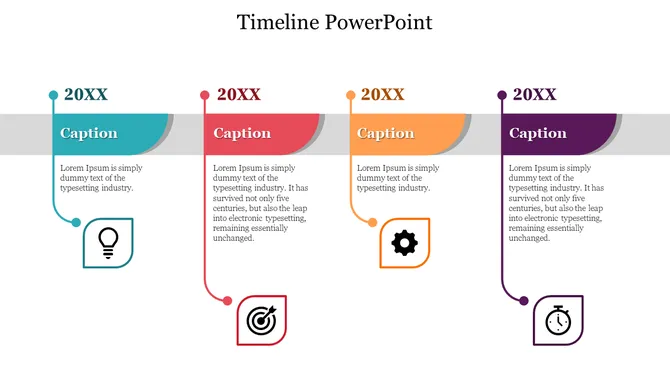
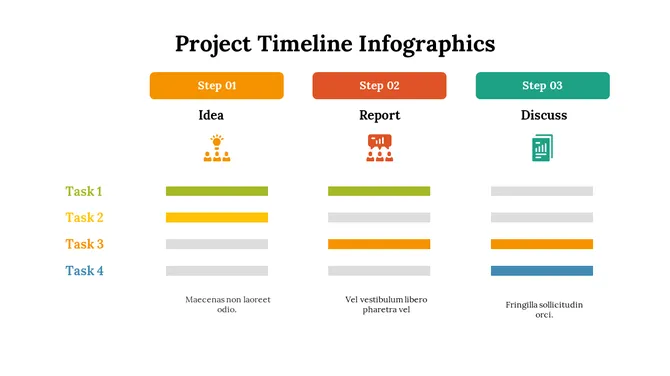
- Vertical Timeline Templates: Events are stacked top to bottom. Works well for detailed step-by-step processes, company histories, and onboarding workflows where you need more space per entry.
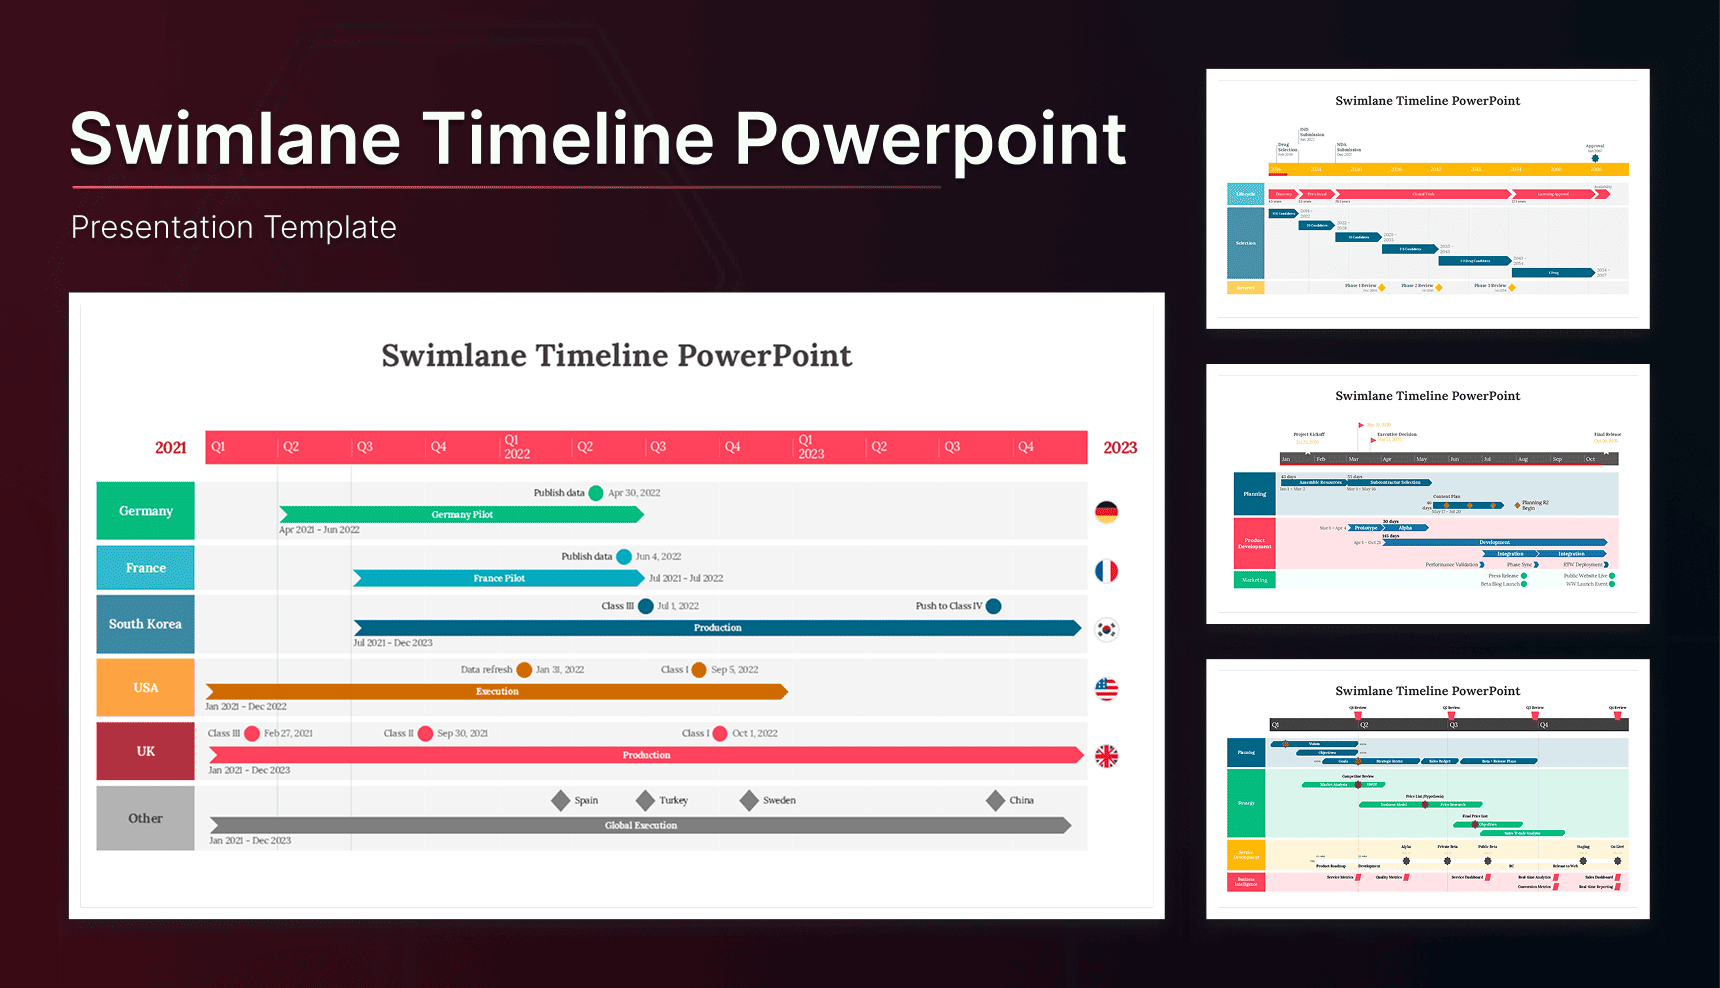
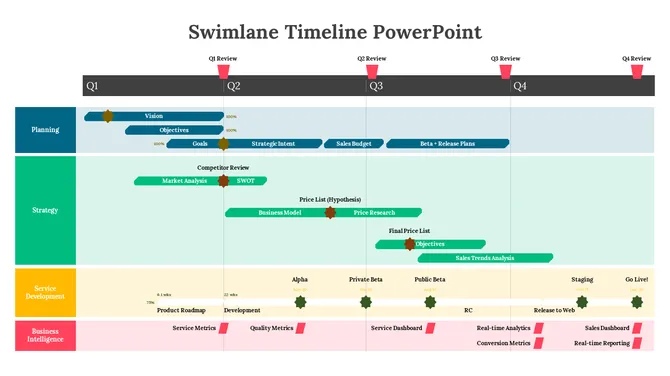
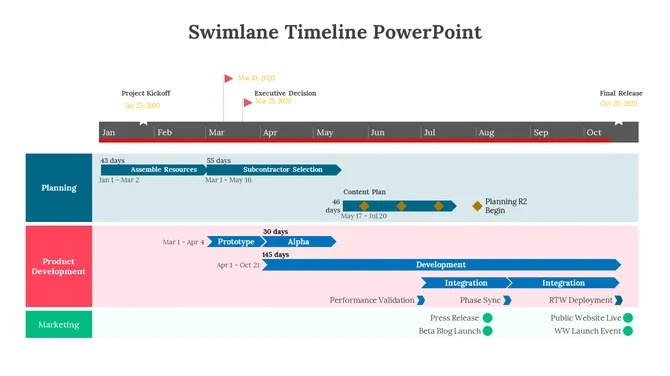
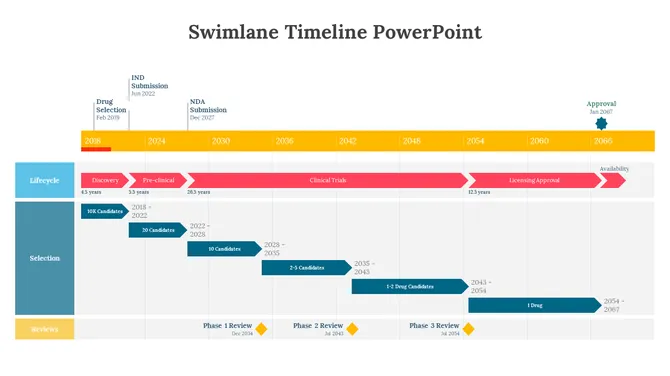
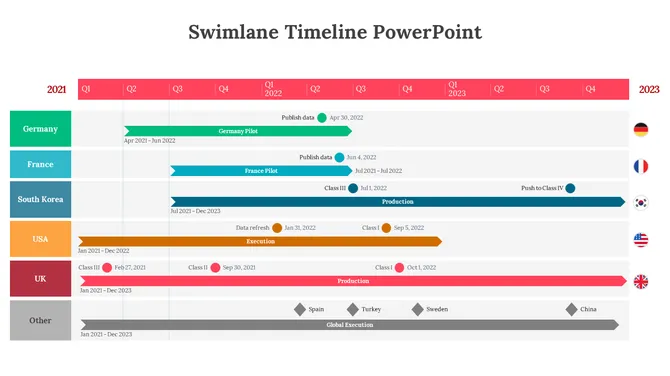
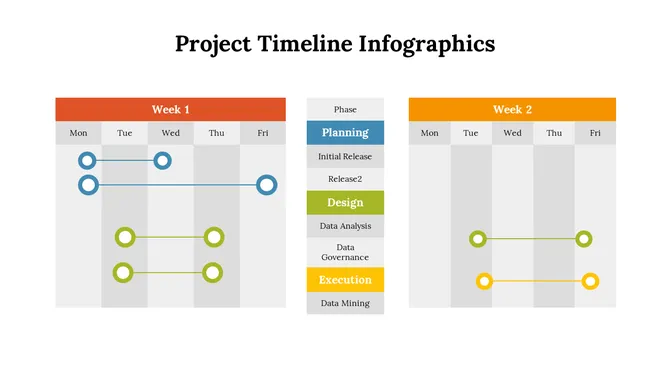
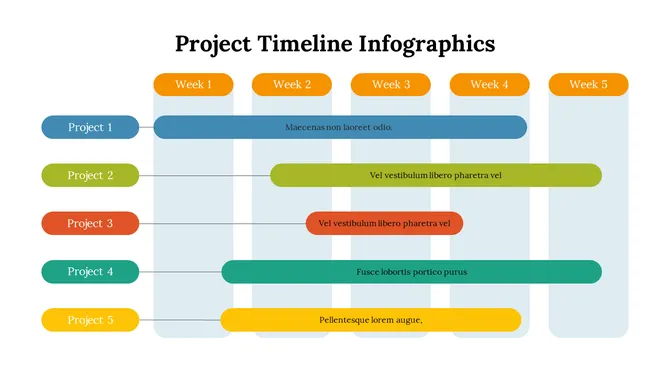
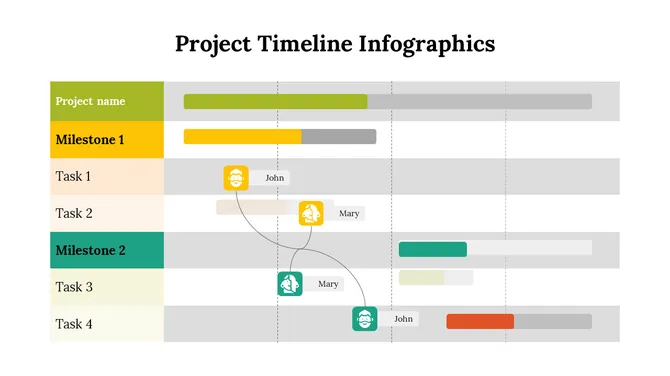
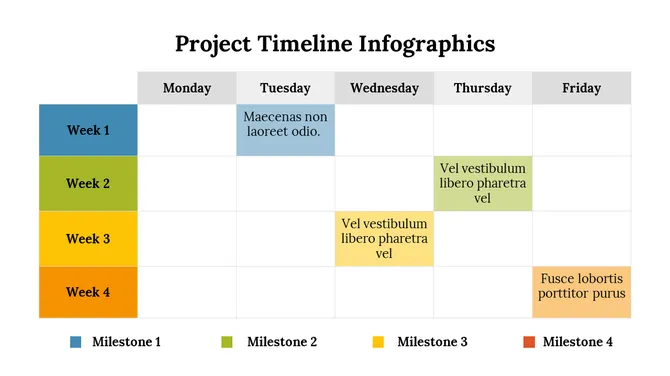
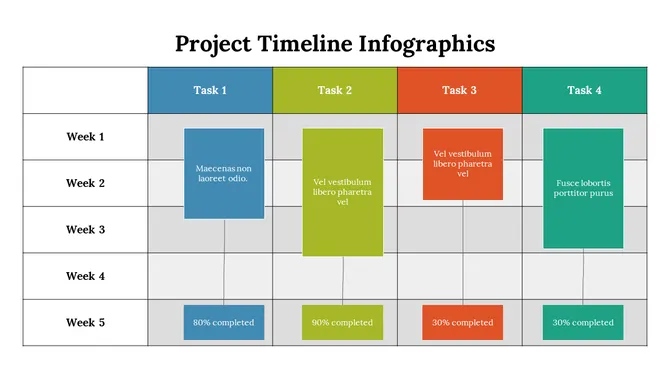
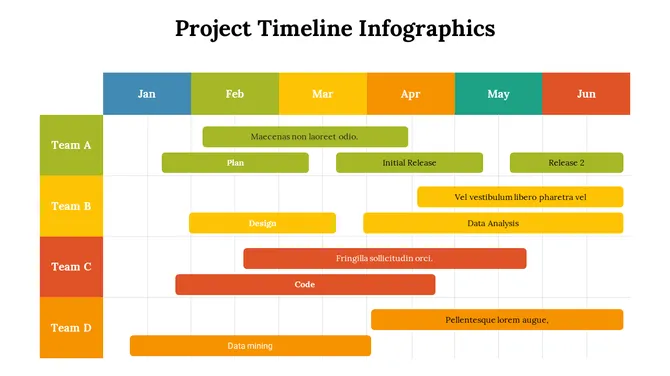
- Swimlane Timeline Templates: Multiple horizontal lanes, each representing a department or team. Shows what different groups are doing simultaneously — and where their work intersects. Essential for project managers handling cross-functional teams.
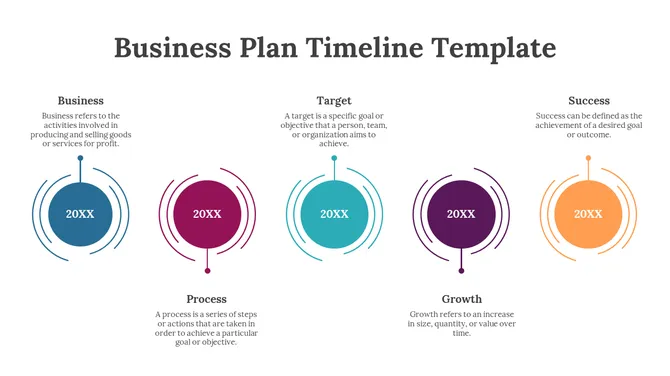
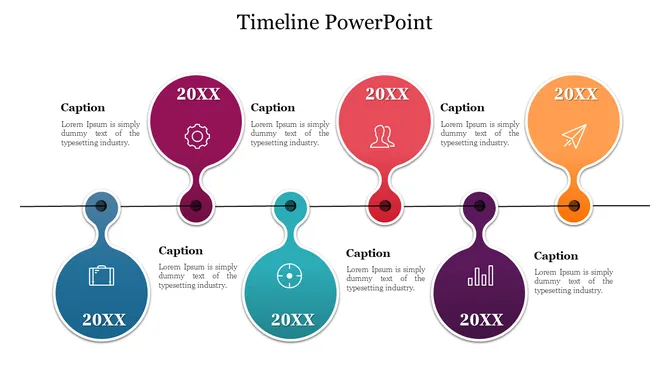
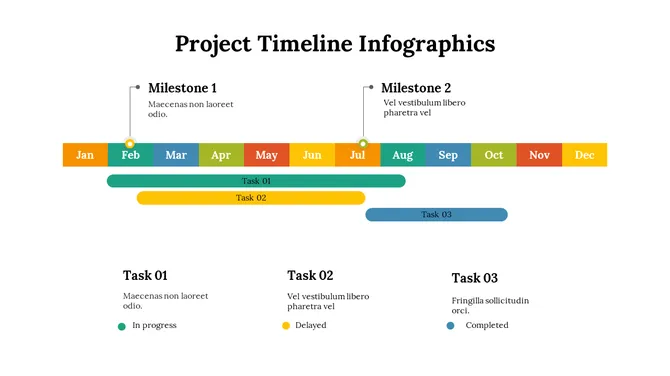
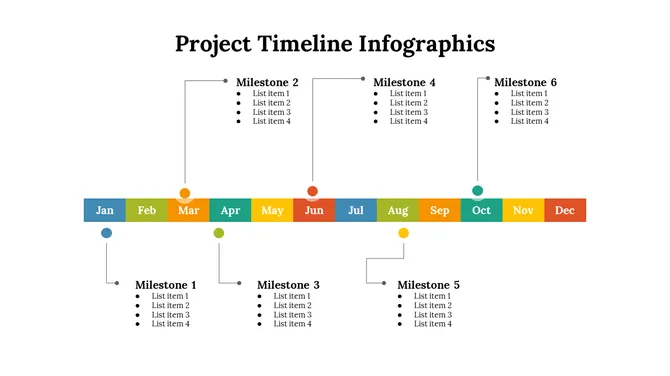
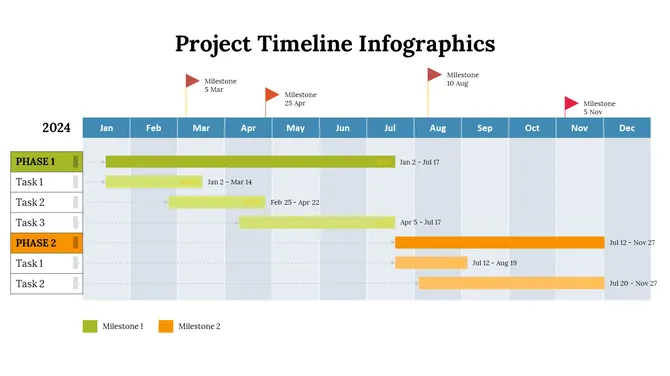
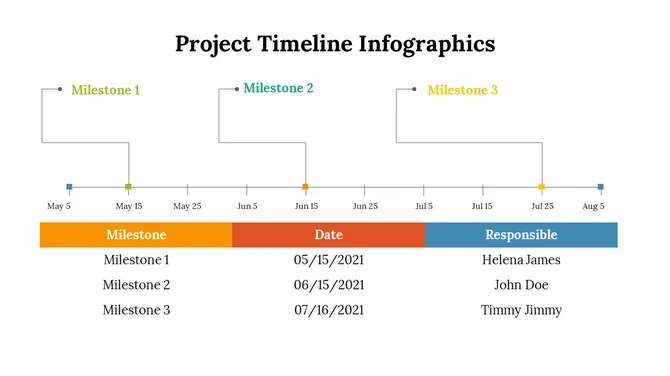
- Milestone Timeline Templates: Focused on key achievement markers rather than continuous tasks. Perfect for investor presentations, annual reviews, and board-level updates.
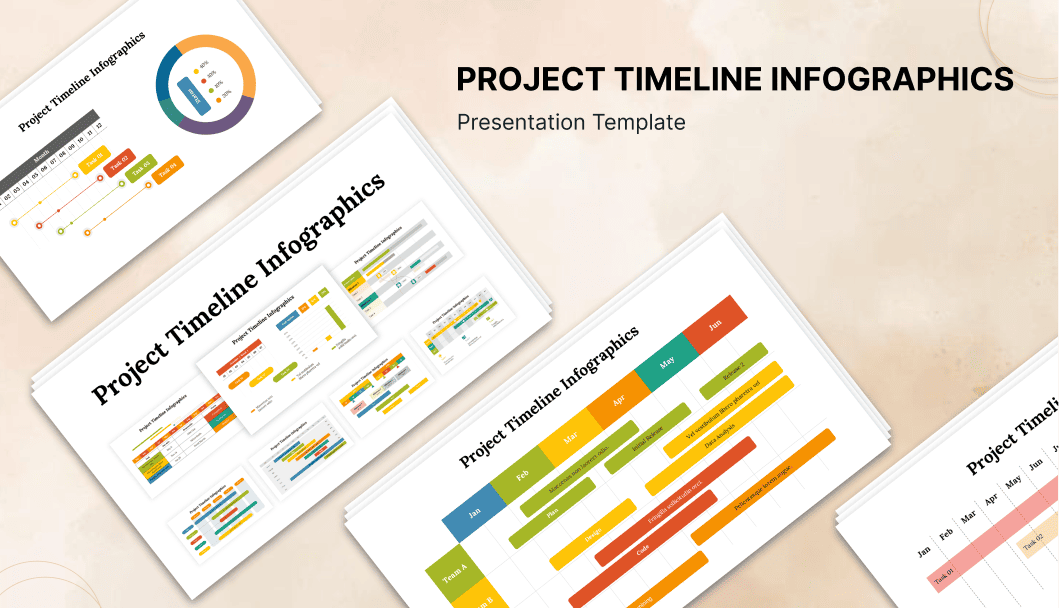
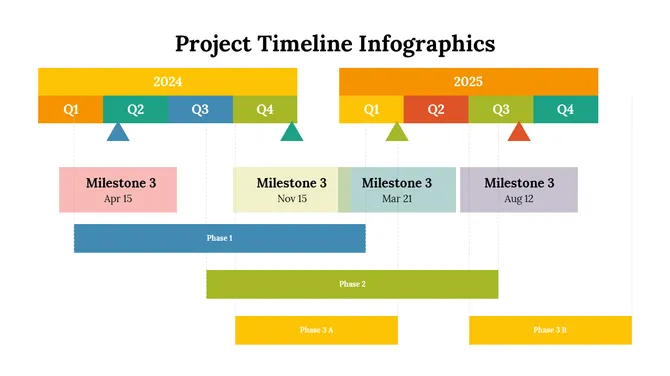
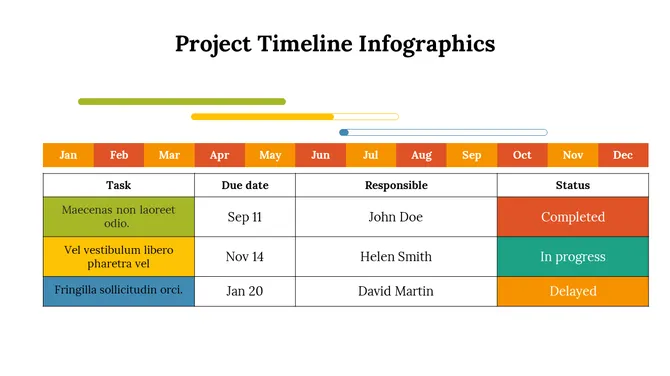
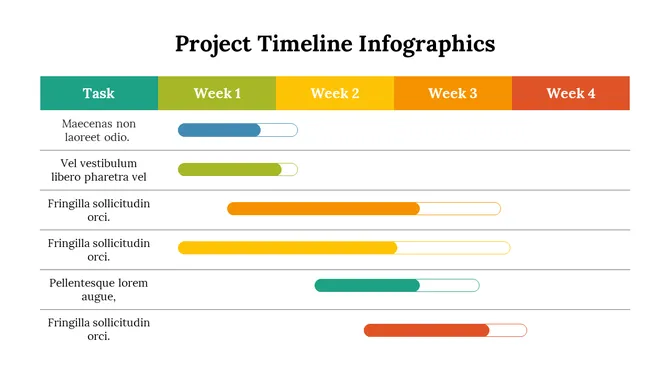
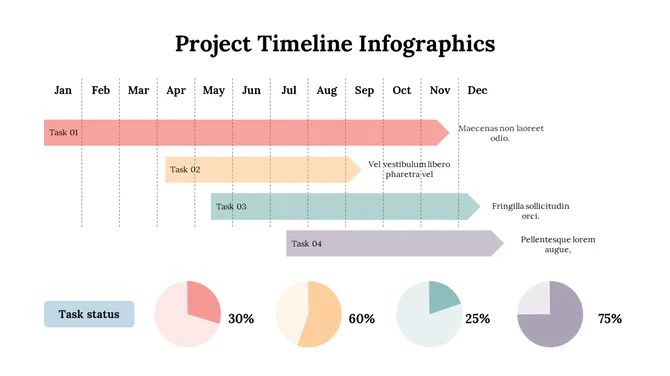
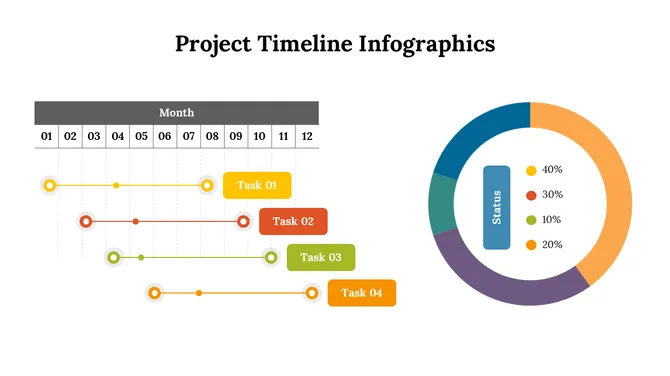
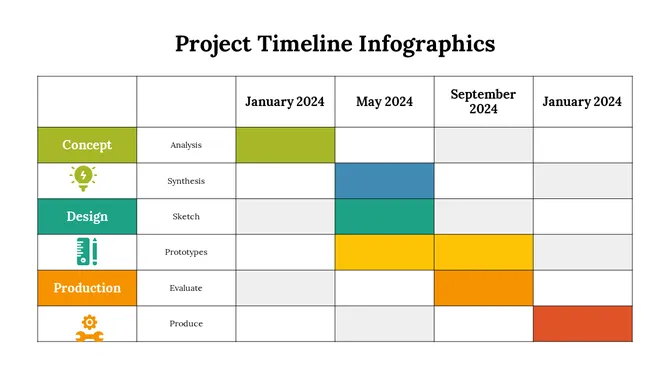
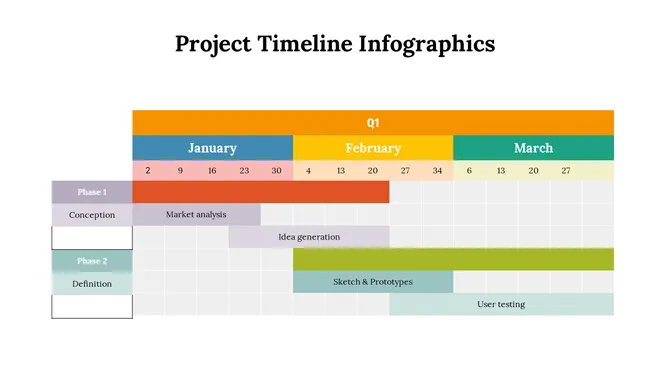
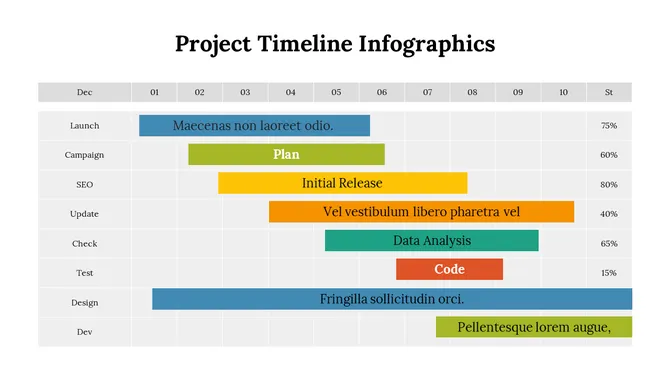
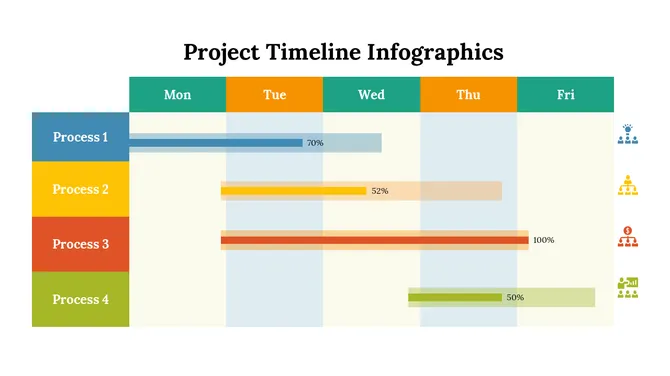
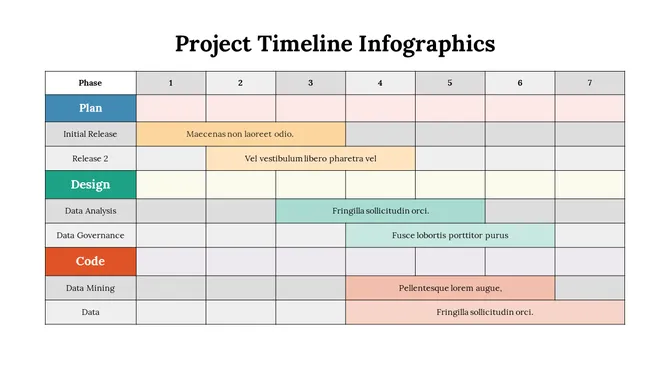
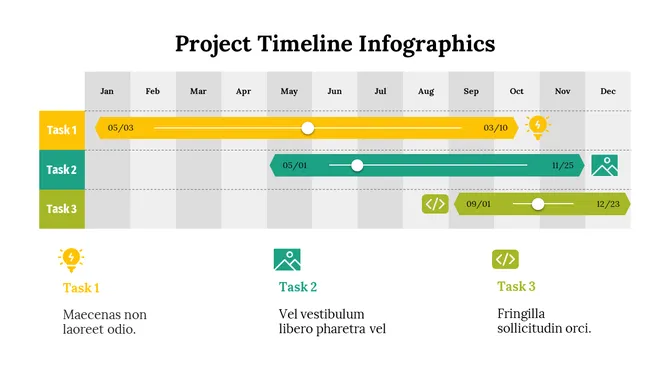
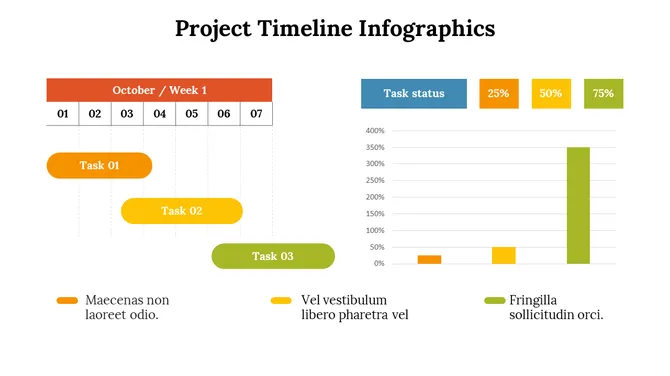
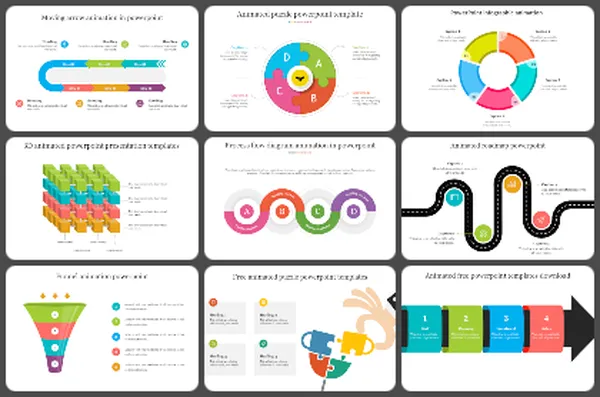
- Gantt Chart Style Timelines: Task bars stretched across a date range. Shows task duration and overlaps clearly. Widely used in project management for construction, software development, and operational planning.
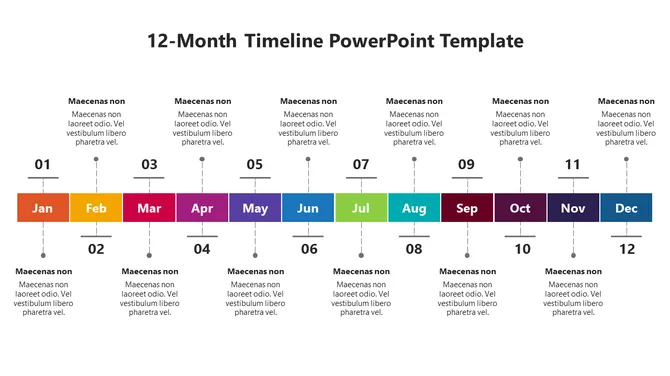
- Monthly and Annual Timeline Templates: Calendar-format layouts that show tasks, events, or goals month by month. The 12-Month Timeline Template is one of the most downloaded formats on SlideEgg, covering January through December in a single editable slide.
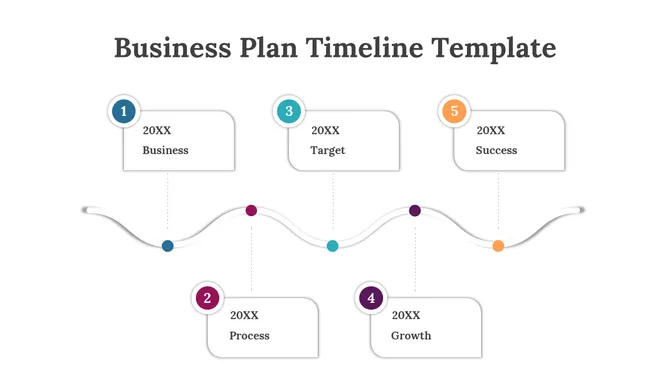
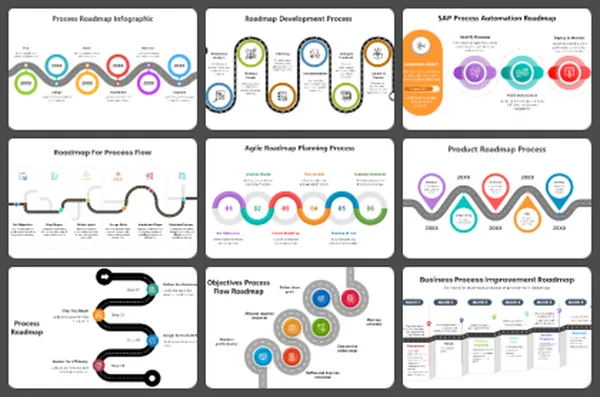
- Roadmap Timeline Templates: Combines timeline structure with directional storytelling. Often used for product development roadmaps and long-term business strategy presentations.
- History Timeline Templates: Designed for educational contexts — great for showing chronological events such as company founding history, world events, or case study progressions.
PowerPoint, Google Slides, or Canva — Which Should You Use?
- PowerPoint remains the most feature-rich option for editing complex multi-element layouts. Use it when you need precise control over shapes, animations, and custom formatting.
- Google Slides is ideal when you need to collaborate in real time or share a presentation via a link. All SlideEgg PPTX downloads import cleanly into Google Slides without losing formatting.
- Canva is a great choice if you prefer a drag-and-drop browser-based editor. Several SlideEgg templates are available directly in Canva, and the AI Customize feature lets you personalize templates online without any downloads.
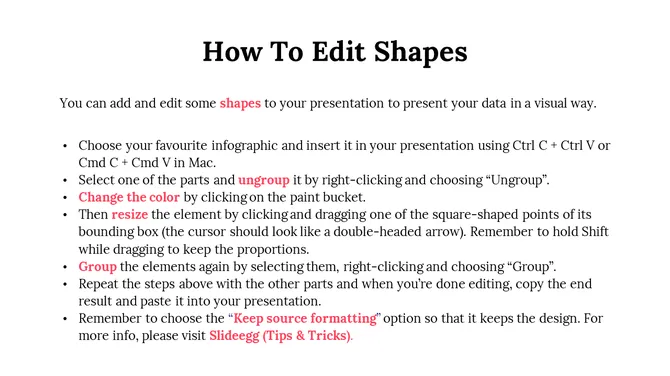
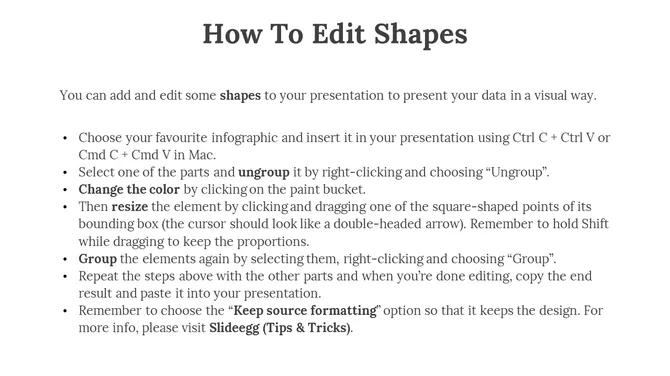
How to Customize a Timeline Template from SlideEgg
What Makes a Timeline Slide Effective?
Start with a Free Timeline Template Today
Related Collections
Frequently Asked Questions
Are these timeline PowerPoint templates free to download?
Yes — SlideEgg offers a large selection of free timeline templates you can download and use without any payment. Free templates are clearly marked with a "Free" label on each card.
Do these timeline templates work in Google Slides?
Yes. All SlideEgg timeline templates are fully compatible with Google Slides. Download the PPTX file, upload it to Google Drive, and open it with Google Slides. You can also open our templates directly in Google Slides from our product page. All editable elements — colors, text, shapes, and icons — remain fully customizable after import.
Can I use these timeline templates in Canva?
Yes. Many SlideEgg timeline templates are available directly in Canva format. You can also use the "AI Customize" button on any template page to personalize it online without downloading any software.
What types of timeline templates are available on SlideEgg?
SlideEgg offers horizontal timelines, vertical timelines, swimlane timelines, Gantt chart-style project timelines, milestone templates, monthly and annual calendar timelines, roadmap timelines, history timelines, and step-by-step process timelines — all compatible with PowerPoint, Google Slides, and Canva.
How do I change the colors in a timeline PowerPoint template?
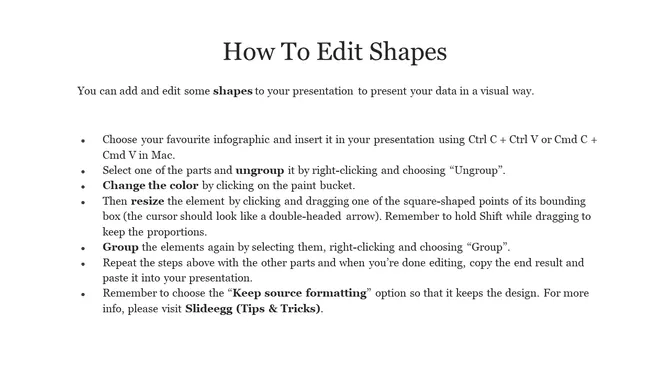
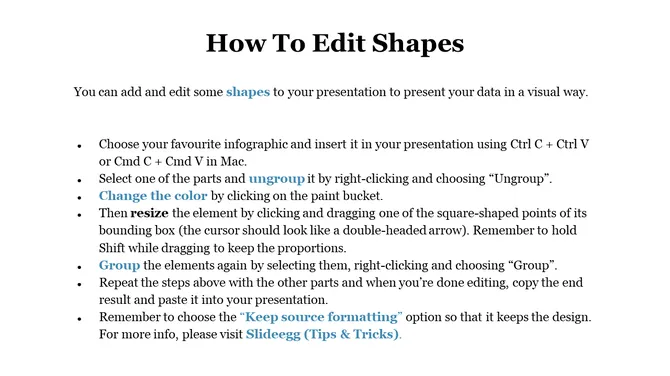
Open the downloaded PPTX file in Microsoft PowerPoint. Click on any shape or element, then select "Format Shape" or use the Shape Fill option to change colors. All SlideEgg templates use standard editable shapes, so every element can be recolored to match your brand or theme.
Can I add or remove milestones from a timeline template?
Yes. All templates are fully editable. You can duplicate milestone markers, delete existing ones, reposition date labels, or resize shapes to fit your content. Use PowerPoint's alignment guides or the Align menu under the Format tab to maintain clean spacing.
What is the difference between a timeline template and a roadmap template?
A timeline template shows events or milestones in chronological order. A roadmap template is more strategic — it shows phases, goals, or future plans with directional flow, often without specific dates. SlideEgg's Timeline Roadmap collection combines both concepts and is ideal for project planning and strategy presentations.
Are there monthly or annual timeline templates available?
Yes. SlideEgg offers dedicated 12-month and annual timeline layouts. The 12-Month Timeline PowerPoint is one of the most popular formats, covering January through December in a single fully editable slide.
Can I use these timeline templates for commercial projects?
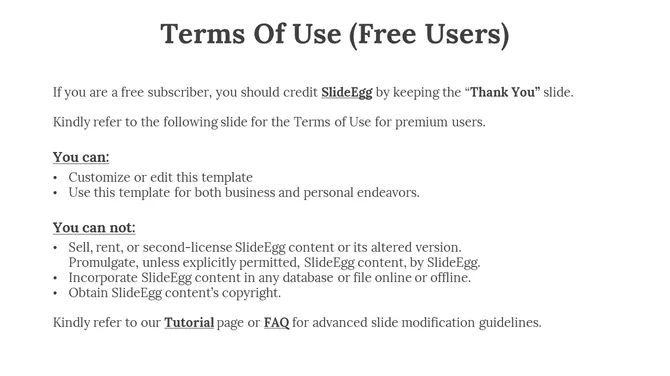
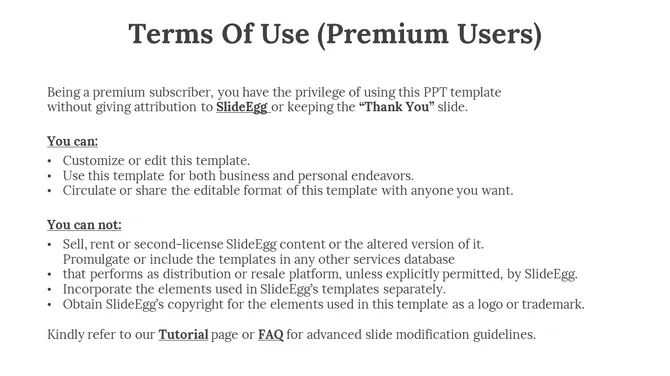
Free templates from SlideEgg are available for personal and commercial use with attribution to SlideEgg. Premium (Pro) templates allow unrestricted commercial use without attribution. Always check the license section for full details before using in a commercial context.
What makes a good timeline PowerPoint slide?
An effective timeline slide shows only the milestones that matter to your audience, uses consistent spacing and color coding, and avoids overcrowding — 4 to 7 milestones per slide is the ideal range for readability. Always include a clear slide title so viewers immediately understand what the timeline represents before they process the visual.
Do these templates work with all versions of Microsoft PowerPoint?
Yes. SlideEgg timeline templates are compatible with Microsoft PowerPoint 2010, 2013, 2016, 2019, 2021, and Microsoft 365 (Office 365).
Is there a Gantt chart or project plan timeline template available?
Yes. SlideEgg offers several Gantt chart-style project timeline templates featuring color-coded task bars and date ranges. Search for "project timeline" or "Gantt chart" in the SlideEgg search bar, or browse the project plan and timeline designs within this collection for planning-focused layouts.