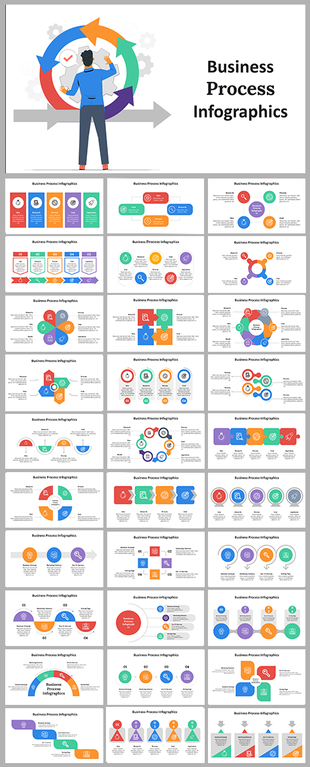
Customized Infographics PPT And Google Slides Template
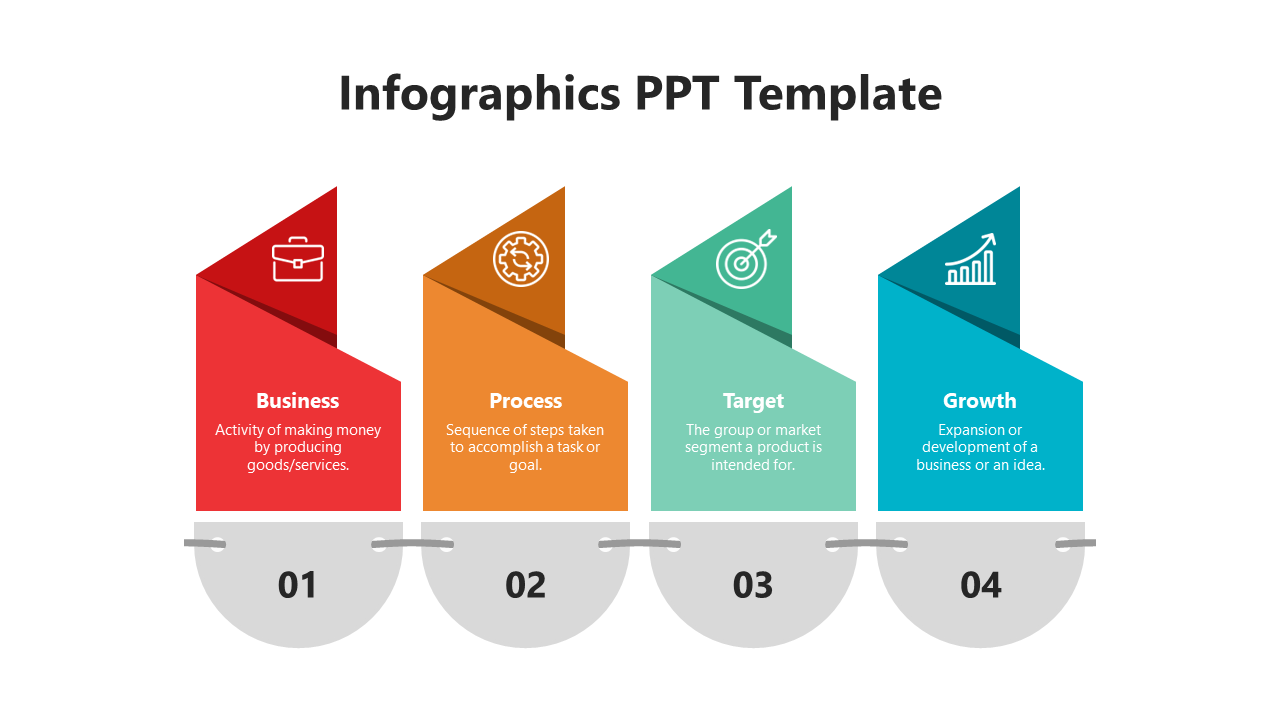
Colorful infographic slide with four triangular sections in red, orange, green, and blue, each with a description and number.
P.ID : 43354
    601 views
    87 Downloads
    Designer
    Santhiya K
    Get Custom Slides by Experts
    Enhance Your Presentations with Add-ins
    Google Slides Add-in
    Access templates directly in Google Slides
    Microsoft PowerPoint Add-in
    Access templates directly in PowerPoint
    GPT Add-on
    AI-powered presentation assistance

    Infographics PPT Template 

    The weight scales are balanced, and the numbers are even! This is a great way to visually explain the difference between two items or situations. The template can be used when talking about weighing quality or fairness or when discussing business goals, plans, or benefits. Here comes your secret weapon to equipoise your comparative data. With the two nodes, ensure that your content is on a whole nine yards explanation. You can make your edits in a jiffy, and that too without more sweat! So, get ready to rock your data in PPTs!

    Features of the template

    • 100% customizable slides and easy to download.
    • Slides are available in different nodes & colors.
    • The slide contained 16:9 and 4:3 formats.
    • Easy to change the slide colors quickly.
    • Well-crafted template with an instant download facility.
    • Two nodes in blue theme.
    Advertisement

    You May Also Like These PowerPoint Templates
    Free
    Add to Wishlist Download Edit
    Red process flow diagram with a lightbulb icon leading to five hexagonal steps connected by lines.
    Free
    Add to Wishlist Download Edit
    Supply chain management PowerPoint template with five colored boxes each featuring an icon with captions on a white backdrop.
    Free
    Add to Wishlist Download Edit
    Visual representation of a business process with four stages, highlighted in distinct colors and featuring relevant icons.
    Free
    Add to Wishlist Download Edit
    Flowchart with circular icons linked by black lines, illustrating business process steps in various colors.