Fantastic Infographics PowerPoint Presentation For Your Need

Infographic presentation with three gradient spheres in blue, green, and orange, each filled to display percentages.
P.ID : 10350
    676 views
    42 Downloads
    Get Custom Slides by Experts
    Instantly Access Templates in PowerPoint

    Downloadable Infographics PowerPoint Presentation


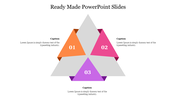
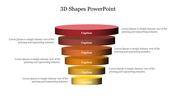
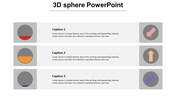
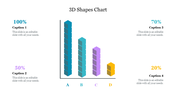
    Introducing our Infographics PowerPoint Presentation. Let’s explore the aesthetics and functionality of the slides in more detail. Each slide contains three circular 3D shapes infographic objects, each filled to a different level representing 50%, 75%, and 90%, respectively. Circles are colored; Blue, green, and orange - each a visual cue for easy data interpretation. The themes below can be edited to tailor the content to your specific needs.

    Staff Whether you’re presenting quarterly reports, marketing strategies, or other business updates, our infographics empower you to effortlessly present compelling data. Delight your colleagues, customers, and stakeholders with stunning visual slides that leave a lasting impact. Download our templates with Google Slides Themes now – where sophistication meets simplicity, innovation meets elegance, and clarity meets impact!

    Features of the template:

    •  Slides are available in 4:3 & 16:9
    • Well-crafted template with instant download.
    • Get slides that are 100% customizable and easy to download
    Advertisement

    You May Also Like These PowerPoint Templates

    Add to Wishlist
    Download
    AI Customize
    PowerPoint slide featuring a central shape with six connected sections, each with space for text on a white backdrop.
    Free
    Add to Wishlist
    Download
    AI Customize
    Business presentation layout with four purple arrows pointing to a central trophy icon, with labeled categories.
    Add to Wishlist
    Download
    AI Customize
    Layered orange funnel representing stages of marketing channels, featuring icons for digital platforms and media.
    Free
    Add to Wishlist
    Download
    AI Customize
    PPT slide with a yellow bar chart showing percentages for the years 2016 to 2021 with a woman standing next to the chart.
    Free
    Add to Wishlist
    Download
    AI Customize
    3D blue sidebar with five stacked options extending into rounded bars, forming a structured technology layout.
    Free
    Add to Wishlist
    Download
    AI Customize
    Business themed slide with a translucent 3D funnel and descriptive sections highlighting various aspects of business.
    Add to Wishlist
    Download
    AI Customize
    Growth slide featuring a 3D staircase graph with stages in yellow, orange, red, purple, and blue blocks, indicating progress.
    Free
    Add to Wishlist
    Download
    AI Customize
    Slide with four green puzzle pieces, each with a corresponding icon and space for text around it.
    Free
    Add to Wishlist
    Download
    AI Customize
    PowerPoint slide with a dark blue pie chart steps divided into four sections, labeled 01 to 04 with placeholder text.
    Free
    Add to Wishlist
    Download
    AI Customize
    3D green pie chart infographic divided into four steps of varying heights, with numbered labels and descriptions around it.
    Add to Wishlist
    Download
    AI Customize
    Brown outlined 3D pyramid with four labeled levels, each connected to corresponding descriptions.
    Free
    Add to Wishlist
    Download
    AI Customize
    Layered 3D infographic with four yellow bars, each extending to a cube with an icon, showing a marketing strategy.
    Add to Wishlist
    Download
    AI Customize
    A slide showing the key components of corporate sales including strategy, messaging, financial services, and business.
    Free
    Add to Wishlist
    Download
    AI Customize
    Slide deck showcasing a 3D pyramid chart with staff hierarchy, numbered sections in various colorful layouts.
    Add to Wishlist
    Download
    AI Customize
    A multi step PowerPoint template featuring icons representing different stages of training and learning processes.
    Free
    Add to Wishlist
    Download
    AI Customize
    SWOT slide featuring four gray circles with descriptive text placed above each icon.
    Free
    Add to Wishlist
    Download
    AI Customize
    A businessman raises hands beside four stacked cylinders in red, yellow, green, and blue, numbered 01 to 04, with arrows.
    Add to Wishlist
    Download
    AI Customize
    Vertical stacked infographic with four labeled sections in blue, purple, green, and yellow representing growth stages.