MILESTONE 🌟 5 Million+ creative minds trust SlideEgg! Grab 80% OFF

Analysis PowerPoint Template and Google Slide Themes

Analysis slide featuring two circular percentage charts, male and female silhouettes, and a four column data table.
P.ID : 33844
    81 views
    7 Downloads
    Get Custom Slides by Experts
    Instantly Access Templates in PowerPoint

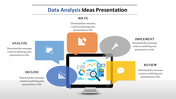
    Best Analysis Presentation Template


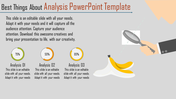
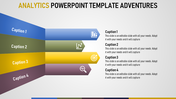
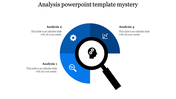
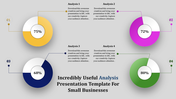
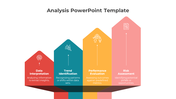
    Illuminate your insights with our Analysis PowerPoint template! Featuring human body icons paired with percentages, this template offers a visually engaging way to showcase your data and findings. Who can use these slides? Professionals across various industries, including analysts, researchers, and consultants, can leverage our template to present their analysis in a clear and impactful manner. Explore our Analysis PowerPoint template today and empower your audience with compelling visualizations! Download it now!

    Feature of the template

    • 100% customizable slides and easy to download.
    • Slides are available in different nodes & colors.
    • The slide is contained in 16:9 and 4:3 format.
    • Easy to change the slide colors quickly.
    • Well-crafted template with an instant download facility. 
    Advertisement

    You May Also Like These PowerPoint Templates

    Add to Wishlist
    Download
    AI Customize
    Three head silhouettes in blue and gray with icons, connected by arrows with captions below, on a white background.
    Add to Wishlist
    Download
    AI Customize
    Analysis PowerPoint template displaying a blue circular diagram with steps from interviewing stakeholders to building BPMN.
    Add to Wishlist
    Download
    AI Customize
    Analysis report template featuring a purple and green area graph comparing five projects, with separate information
    Add to Wishlist
    Download
    AI Customize
    Six oval elements in gray with icons and labels for analysis categories placed in white backdrop.
    Add to Wishlist
    Download
    AI Customize
    Modern design featuring a circular orange arc in the center, flanked by six numbered steps on curved paths on both sides.
    Add to Wishlist
    Download
    AI Customize
    Three vertical blocks in yellow, blue, and green, each with numbers and business analytics icons on a light background.
    Add to Wishlist
    Download
    AI Customize
    A pack of DESC model slides with four elements in various colorful layout designs with text descriptions.
    Add to Wishlist
    Download
    AI Customize
    Circular flowchart with colored arrows in blue, purple, orange, and yellow, pointing to icons and text areas beneath.
    Add to Wishlist
    Download
    AI Customize
    A PowerPoint slide featuring a magnifying glass focusing on data analysis with icons representing various analytics metrics.
    Add to Wishlist
    Download
    AI Customize
    Four step layout with colored tabs in orange, blue, green, and purple, featuring icons and white text boxes.
    Add to Wishlist
    Download
    AI Customize
    A strategic analysis format diagram with a triangle structure representing political, economic, and technological factors.
    Add to Wishlist
    Download
    AI Customize
    Capability Gap PowerPoint And Google Slides Template
    Add to Wishlist
    Download
    AI Customize
    Structured analytics template with blue visuals and pentagonal icons illustrating three data tracking elements.
    Add to Wishlist
    Download
    AI Customize
    The best break even analysis ppt template model
    Add to Wishlist
    Download
    AI Customize
    Analytics PPT slide showing web analytics uses from traffic source analysis to conversion optimization with icons.
    Add to Wishlist
    Download
    AI Customize
    SWOT diagram with curved arrows in blue, purple, orange, and yellow, pointing to each quadrant.