Innovative Timeline Chart PPT And Google Slides Templates


Creative Timeline Chart PowerPoint Template
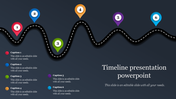
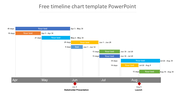
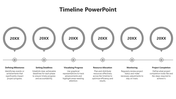
A timeline chart is a graphical representation used to display chronological events or milestones over time, aiding in project planning, historical analysis, or process visualization. Professionals across various fields, including project managers, historians, educators, and researchers, utilize timeline charts to illustrate sequences of events or tasks. The template, featuring a gray color scheme, provides a neutral backdrop for presenting timelines. Gray is often associated with balance and neutrality, making it suitable for conveying information without distractions. With its understated yet professional design, this template effectively communicates chronological data, ensuring clarity and coherence in depicting the progression of events or activities over time.
Features of this template
- 100% customizable slides and easy to download.
- The slide contains 16:9 and 4:3 formats.
- Easy to change the colors of the slide quickly.
- Highly compatible with PowerPoint and Google Slides.


You May Also Like These PowerPoint Templates


