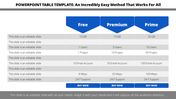
Best Sales Update Template PowerPoint Presentation

Color coded two column table, with alternating colors for each month, displaying 2022 sales in millions.
P.ID : 64027
    260 views
    17 Downloads
    Get Custom Slides by Experts
    Instantly Access Templates in PowerPoint

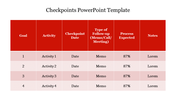
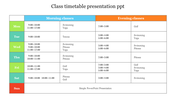
    Update Your Sales Details Through The Nodes:


    Add this sales update template to the cart, which can be used on many of your business-themed slides. You can use this template on your professional and informal templates, which relate to the sales analysis. You can find that the nodes given here are filled with monthly captions, which clearly explain your monthly review of sales and business. 

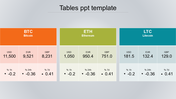
    This kind of template's usage on your presentation slides can be used to analyze your profit and your business's income. The colors insert in this template attract anyone who sees it. So, use this potential Sales Update Template to present accurate information about your business.


    Features Of This Template:

    • 100% customizable slides and easy to download
    • Slides are available in different nodes & colors.
    • The slides contained 16:9 and 4:3 format.
    • Easy to change the slide colors quickly.
    • Well-crafted Template with instant download facility.
    • Crisp and elegant font style. 
    • The best Template with attractive nodes.
    Advertisement

    You May Also Like These PowerPoint Templates

    Add to Wishlist
    Download
    AI Customize
    Weekly school timetable displayed in a colorful grid with subjects organized by day, with a graduation cap at the top.
    Add to Wishlist
    Download
    AI Customize
    Slide featuring a colorful target table with four columns labeled target 1 to target 4, and four rows with captions.
    Add to Wishlist
    Download
    AI Customize
    Structured week-in-review slide with sections for project name, milestones, and key risks in colored boxes.
    Free
    Add to Wishlist
    Download
    AI Customize
    Simple table with a blue title bar, showing january to march figures for sales and financial metrics.
    Add to Wishlist
    Download
    AI Customize
    Colorful stock heat map slide displaying various scores with placeholder text.
    Add to Wishlist
    Download
    AI Customize
    Color coded two column table, with alternating colors for each month, displaying 2022 sales in millions.
    Free
    Add to Wishlist
    Download
    AI Customize
    Presentation slide layout illustrating key elements for high quality PowerPoint including steps with icons.
    Add to Wishlist
    Download
    AI Customize
    Monthly calendar layout with days highlighted in different colors, against a background of sticky notes.
    Add to Wishlist
    Download
    AI Customize
    Slide with three column table displaying circular progress bars in blue, teal, and green, with bulleted text below.
    Add to Wishlist
    Download
    AI Customize
    A colorful weekly planner infographic slides with sections for each day of the week, including Monday to Sunday.
    Add to Wishlist
    Download
    AI Customize
    A table with maroon header and alternating light and dark gray rows listing employee tasks and time data.
    Add to Wishlist
    Download
    AI Customize
    After Action Report layout with key sections outlining intended goals presented in a colorful structured format.
    Add to Wishlist
    Download
    AI Customize
    January 2022 calendar with a sunflower background each day has a number and a checkmark for completed tasks.
    Add to Wishlist
    Download
    AI Customize
    A table layout with headers in red, purple, blue, and green, showing seven rows of information.
    Add to Wishlist
    Download
    AI Customize
    Colorful table slide showcasing options with headers for awards, design, support, and brainstorming with placeholder text.
    Add to Wishlist
    Download
    AI Customize
    Remembering slide featuring six vibrant horizontal sections, each paired with descriptive text.
    Add to Wishlist
    Download
    AI Customize
    KPI slide table with yearly financial data from FY16 to FY19 from operations to cash equivalents with placeholder text.
    Add to Wishlist
    Download
    AI Customize
    Slide showing company performance metrics in a table, with colored arrows in the PI trends column.