Effective Presentation Template For Strategy Design
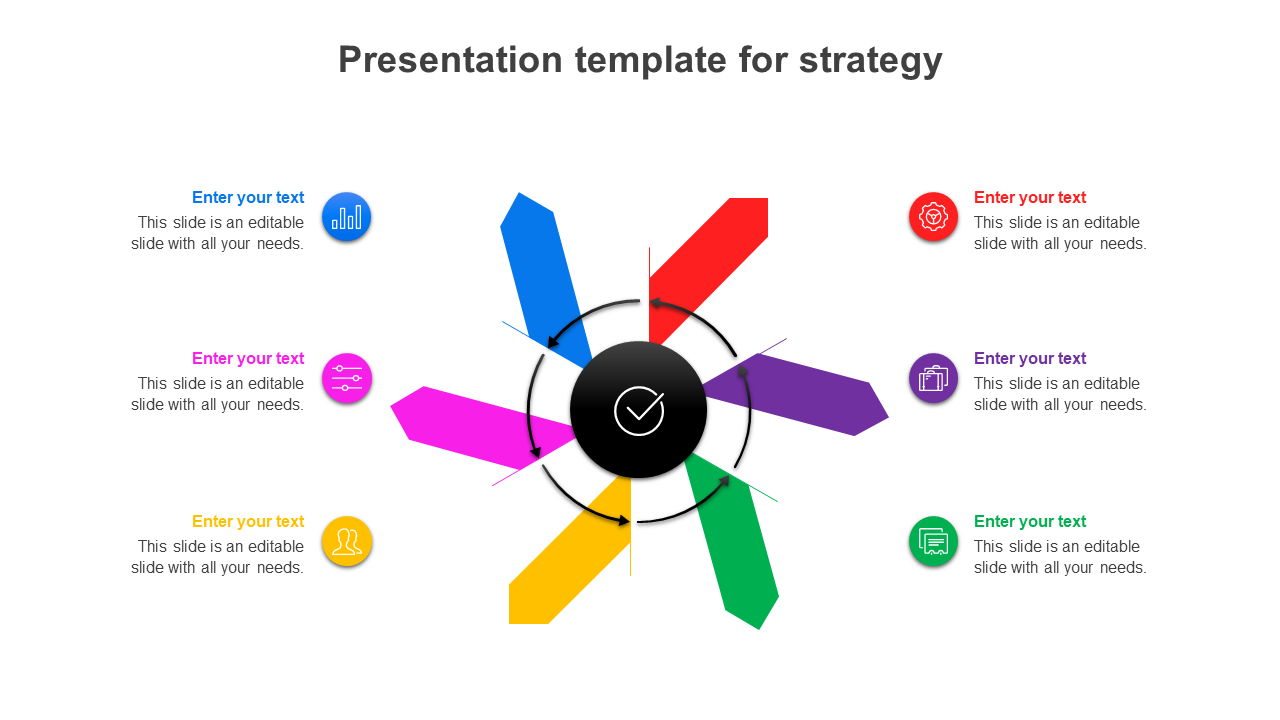
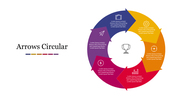
Strategic planning infographic with six colorful arrows radiating from a central black circle, each linked to text and icons.
P.ID : 41830
    136 views
    19 Downloads
    Designer
    Kavitha
    Get Custom Slides by Experts
    Enhance Your Presentations with Add-ins
    Google Slides Add-in
    Access templates directly in Google Slides
    Microsoft PowerPoint Add-in
    Access templates directly in PowerPoint
    GPT Add-on
    AI-powered presentation assistance

    Visually Compelling Business Strategy Slide

    Trying to add innovation to your business presentations to attract investors or clients? How about trying this elegant Business Strategy PowerPoint Template? Its colorful infographics will convey your business strategies more beautifully, which will seize your viewer's eyes. It has a fan design with six arrows and six text blocks to present your strategies innovatively. The milky white background will add elegance to your presentation and pops the graphics and text. Try it in your next business presentation to hit great success!

    Features of the template

    • 100% customizable slides and easy to download.
    • Slides are available in different nodes & colors.
    • The slide contains 16:9 and 4:3 formats.
    • Easy to change the colors of the slide quickly.
    • Well-crafted template with an instant download facility.
    • Colorful business slide with six nodes.

    Advertisement

    You May Also Like These PowerPoint Templates
    Free
    Add to Wishlist Download Edit
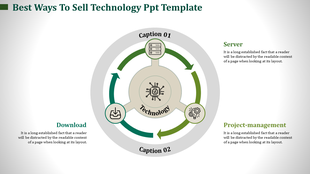
    Technology slide featuring a central icon and a circular flow with captions and green arrows connecting three concepts.
    Free
    Add to Wishlist Download Edit
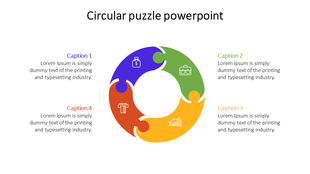
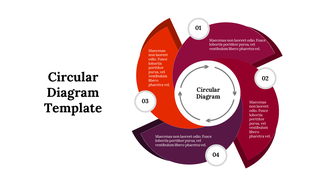
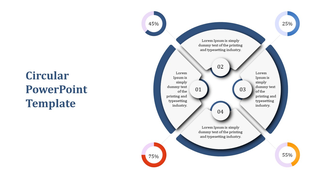
    An informative circular diagram slide featuring four numbered sections, each with descriptive placeholder text.
    Add to Wishlist Download Edit
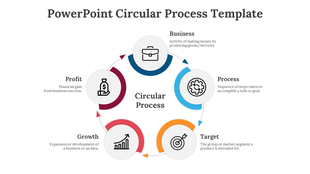
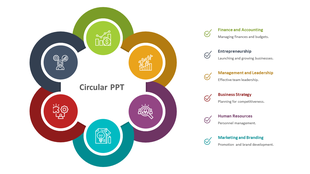
    Business process diagram showing a circular flow with six colored parts, icons, and placeholders text areas.
    Free
    Add to Wishlist Download Edit
    Circular infographic with ten numbered colorful segments in blue, green, and orange shades, creating a pie chart layout.