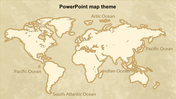
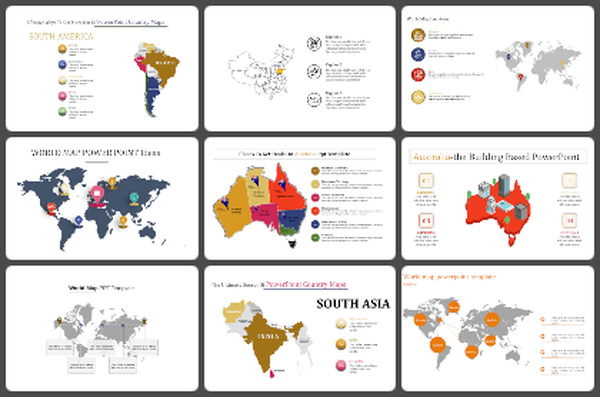
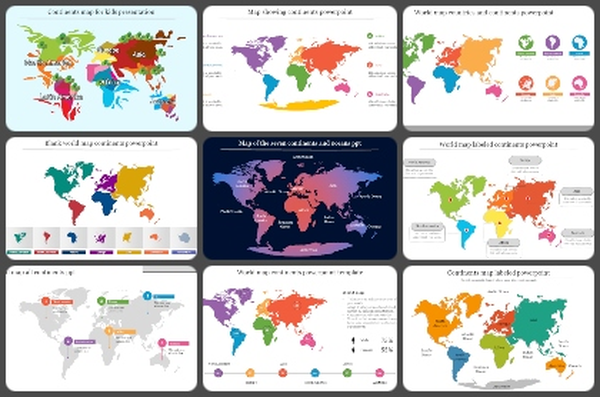
World Map PPT Template & Google Slides Theme With 6 Circles

World map with six circles showing different percentage values, each placed with  location and label text.
P.ID : 35041
    449 views
    33 Downloads
    Get Custom Slides by Experts
    Instantly Access Templates in PowerPoint

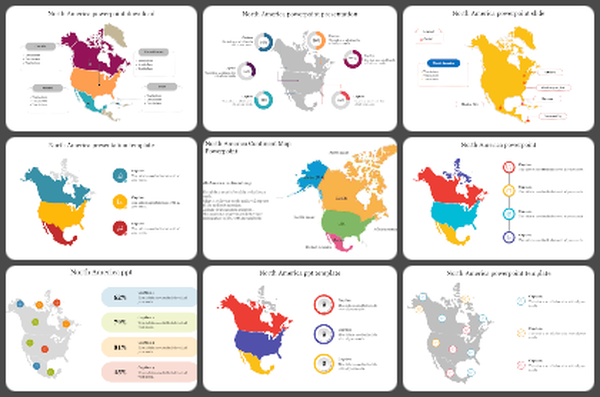
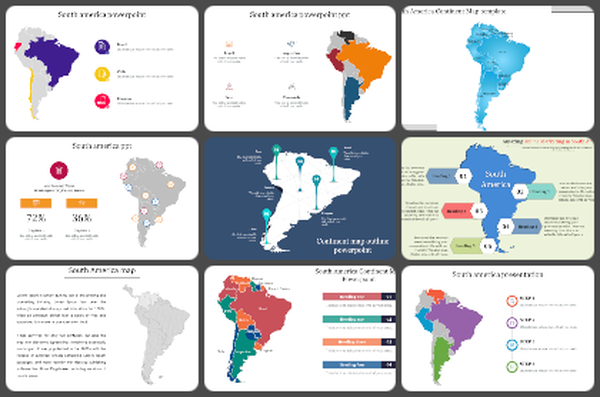
    Map Presentation Template


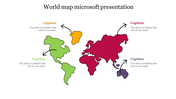
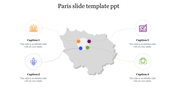
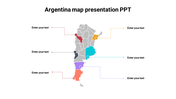
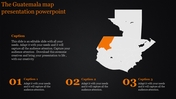
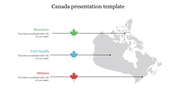
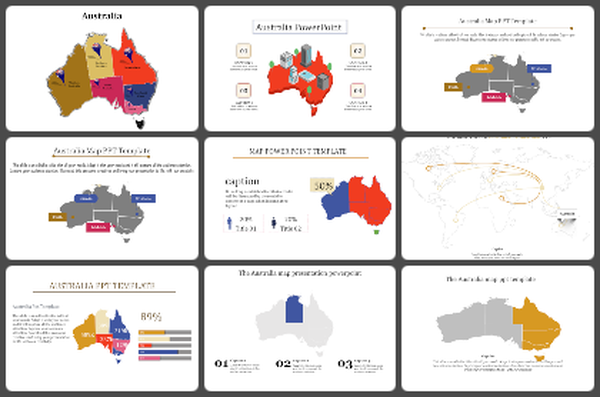
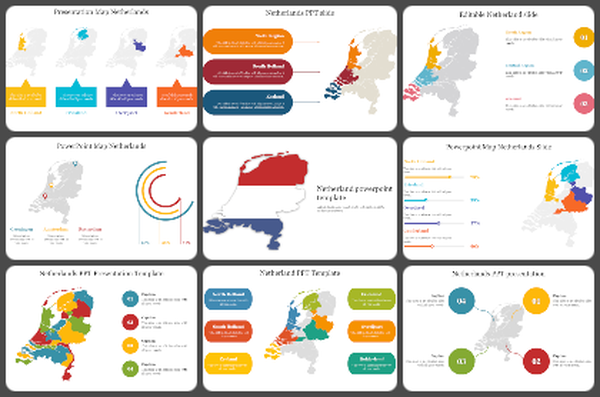
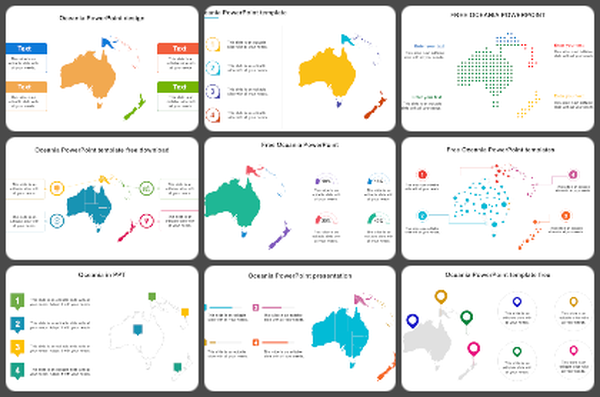
    Get ready to add a professional touch to your presentations with Our Map PowerPoint Template and Google Slides. It is like a magic wand for your slides. It's perfect for professionals, students, or anyone who wants to make their presentations pop. Imagine this: a colourful world map background with continents popping out, and six colourful circles with spaces for your words. It's like painting your ideas onto a global canvas! Whether you're talking about business, geographic infographics, or anything else global, this template is your new best friend. Just plug in your words and customize the colors to match your style. And with the template, you'll leave a mark on your audience they won't forget. Get prepared to impress your audience in ways you never thought possible!. It's time to make your ideas shine!

    Features of the template:

    • Slides are available in different nodes & colors.
    • Easy to change the slide colors.
    • Well-crafted template with instant download.
    Advertisement

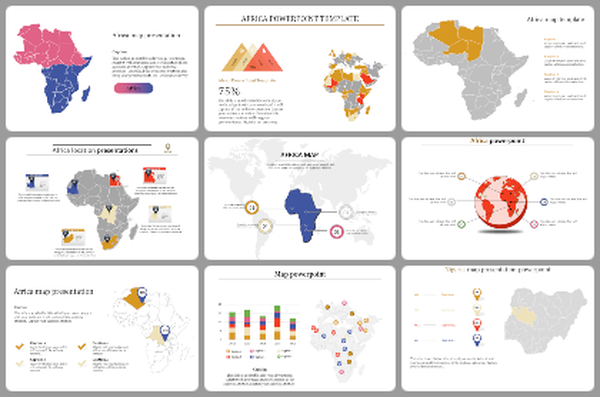
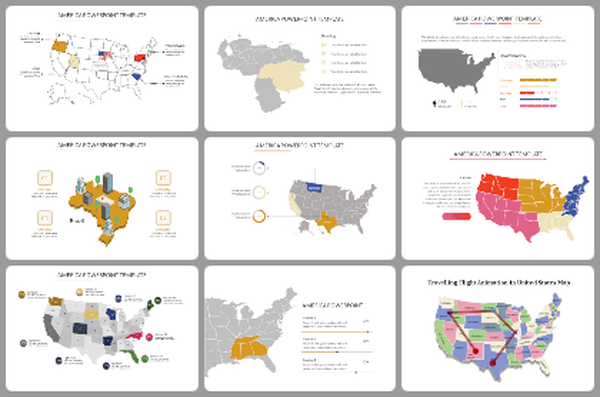
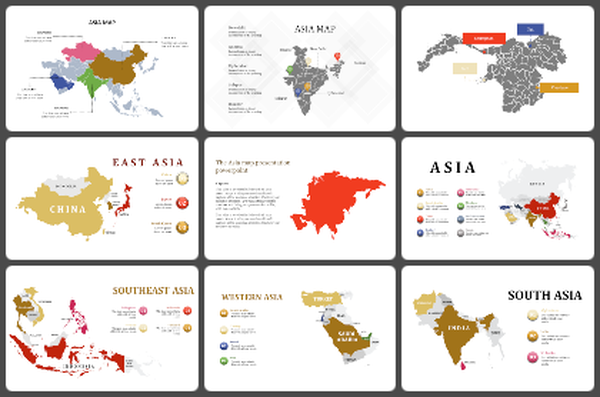
    You May Also Like These PowerPoint Templates

    Free
    Add to Wishlist
    Download
    AI Customize
    Services slide with a workspace scene on the left, showing a woman writing notes on a desk with a laptop.
    Add to Wishlist
    Download
    AI Customize
    World map PowerPoint slide with percentage circles highlighting different regions with percentages and captions.
    Add to Wishlist
    Download
    AI Customize
    PowerPoint slide featuring a world map with three location markers, each with text boxes.
    Add to Wishlist
    Download
    AI Customize
    World map slide with caption areas linked by horizontal colored lines representing different regions.
    Free
    Add to Wishlist
    Download
    AI Customize
    Blue-themed infographic featuring a globe and three doughnut charts labeled 40%, 60%, and 70%.
    Add to Wishlist
    Download
    AI Customize
    Illustrated Witcher world map with colored continents,  indicating different regions and color-coded caption areas.
    Free
    Add to Wishlist
    Download
    AI Customize
    World map PowerPoint slide with highlighted countries USA, Germany, a number counter, and a pie chart on a white theme.
    Add to Wishlist
    Download
    AI Customize
    Mapa mundi para apresentacao with numbered regions, each displaying a placeholder text on a colorful, interactive map.
    Add to Wishlist
    Download
    AI Customize
    A slide showing a world map illustrating the seven continents and five oceans in shades of blue with a beige background.
    Add to Wishlist
    Download
    AI Customize
    Pack of slides with multiple world maps showing the continents and oceans, using distinct color schemes.
    Free
    Add to Wishlist
    Download
    AI Customize
    Editable World Map For PowerPoint Download Slide
    Add to Wishlist
    Download
    AI Customize
    Slide featuring an interactive world map with colored markers indicating various locations with percentage captions below.
    Add to Wishlist
    Download
    AI Customize
    Color coded world map highlighting the five major oceans pacific, atlantic, arctic, southern, and indian.
    Add to Wishlist
    Download
    AI Customize
    A blank, printable world map displaying the seven labeled continents from north america to australia.
    Add to Wishlist
    Download
    AI Customize
    Creative world map highlighting South America, Africa, and Australia in color, with labeled captions on the right side.
    Free
    Add to Wishlist
    Download
    AI Customize
    Gray world map with circular icons in red, green, blue, and yellow marking different locations, each labeled with a caption.
    Add to Wishlist
    Download
    AI Customize
    Cool world map slide showcasing annual data points for 2019, 2020, 2022, and 2023 with colorful markers.