PowerPoint Table Template for Clear Data Visualization

Table PowerPoint template displaying monthly data with text and numerical values for March to September.
P.ID : 33904
    1.1K+ views
    65 Downloads
    Get Custom Slides by Experts
    Instantly Access Templates in PowerPoint

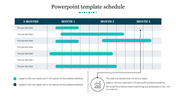
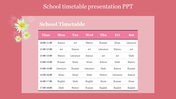
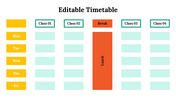
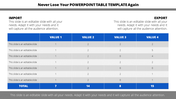
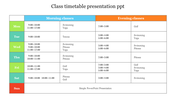
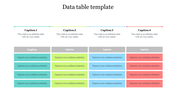
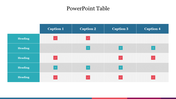
    Table PowerPoint Presentation Template


    In a world where every detail counts, your presentations deserve nothing but the best. Just have a look at Our Table PowerPoint Template. It helps you to add your style. Think of a cool table layout with strong columns on a bold red background. Each cell is shaded in grey, making everything super easy to read. Whether you're a pro, a student, or anyone who wants to nail their presentations, this template is for you.

    It's perfect for reports, pitches, or school projects. Just plug in your info, tweak the colors if you like, and wow your audience in no time! It's super easy to use. Customize it with your stuff. They're made with care to help you shine in front of any crowd. Join lots of happy users who've used our slides to rock their presentations with confidence. Grab it today and see the difference it makes in your presentations.

    Features of the template:

    • Slides are available in different nodes & colors.
    • Easy to change the slide colors.
    • Well-crafted template with instant download.
    Advertisement

    You May Also Like These PowerPoint Templates

    Add to Wishlist
    Download
    AI Customize
    A colorful table with five columns and multiple rows, filled with numbers and text areas under colorful headers.
    Add to Wishlist
    Download
    AI Customize
    Eye-Catching Colorful Heat Map PowerPoint Template
    Add to Wishlist
    Download
    AI Customize
    Weekly school timetable displayed in a colorful grid with subjects organized by day, with a graduation cap at the top.
    Add to Wishlist
    Download
    AI Customize
    A weekly calendar timeline template with five days Mon to Fri and event plan fields for each day.
    Free
    Add to Wishlist
    Download
    AI Customize
    Simple table with a blue title bar, showing january to march figures for sales and financial metrics.
    Add to Wishlist
    Download
    AI Customize
    Colorful stock heat map slide displaying various scores with placeholder text.
    Add to Wishlist
    Download
    AI Customize
    Color coded two column table, with alternating colors for each month, displaying 2022 sales in millions.
    Free
    Add to Wishlist
    Download
    AI Customize
    Presentation slide layout illustrating key elements for high quality PowerPoint including steps with icons.
    Add to Wishlist
    Download
    AI Customize
    Monthly calendar layout with days highlighted in different colors, against a background of sticky notes.
    Add to Wishlist
    Download
    AI Customize
    Slide with three column table displaying circular progress bars in blue, teal, and green, with bulleted text below.
    Add to Wishlist
    Download
    AI Customize
    Training gap analysis table with questions on safety policies, answers, and implementation status columns.
    Add to Wishlist
    Download
    AI Customize
    A colorful weekly planner infographic slides with sections for each day of the week, including Monday to Sunday.
    Free
    Add to Wishlist
    Download
    AI Customize
    Organized daily agenda with a grid layout, highlighting activities across days with red, orange, and yellow blocks.
    Add to Wishlist
    Download
    AI Customize
    A table with maroon header and alternating light and dark gray rows listing employee tasks and time data.
    Add to Wishlist
    Download
    AI Customize
    Slide featuring a table of contents with five titles, each displaying related sections and contents.
    Add to Wishlist
    Download
    AI Customize
    After Action Report layout with key sections outlining intended goals presented in a colorful structured format.
    Add to Wishlist
    Download
    AI Customize
    Revenue analysis report (2021-2025) showing revenue, gross profit, expenses, and net income with variance percentages.