Free - Download Unlimited PowerPoint Slide Puzzle Pieces Slides

Free
Yellow circular puzzle diagram with five sections, each featuring an icon, with text areas placed around it.
P.ID : 42964
    529 views
    285 Downloads
    Get Custom Slides by Experts
    Instantly Access Templates in PowerPoint

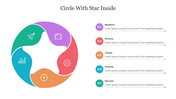
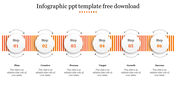
    Circle Shape Puzzle Template For Presentation

    Puzzles are similar to toys in that they put people's knowledge or problem-solving talents to the test. Even when they have all of the parts, many people struggle to solve the puzzle. So, if you take the time to think and precisely integrate things, you will reach the peak. With our greatest PowerPoint slide puzzle, it's time to list all of your business challenges like jigsaw pieces. In a minute, you can connect them one by one and sort them out by joining step by step using clues and ideas. With the greatest plans, our puzzle slide can solve all of your company's difficulties.

    Features of the template

    • 100% customizable slides and easy to download.
    • Slides are available in different nodes & colors.
    • The slide contained 16:9 and 4:3 formats.
    • Easy to change the slide colors quickly.
    • It is a well-crafted template with an instant download facility.
    • It is the best puzzle slide.
    • Highly compatible with PowerPoint, Google Slides, and Canva Presentation.
    Advertisement

    You May Also Like These PowerPoint Templates

    Free
    Add to Wishlist
    Download
    AI Customize
    Circular process slide with six green arrows forming a loop, numbered 01 to 06, surrounding a briefcase icon at the center.
    Add to Wishlist
    Download
    AI Customize
    Horizontal layout with five gradient-colored circles, in purple, blue, and green, connected by a curved line.
    Add to Wishlist
    Download
    AI Customize
    SDLC diagram with interconnected colored diamonds representing stages like analysis, design, and testing.
    Add to Wishlist
    Download
    AI Customize
    A four-step process displayed in yellow, orange, green, and purple rectangles with arrows connecting each step.
    Add to Wishlist
    Download
    AI Customize
    Visual representation of business process improvement methods, featuring colored gears labeled with key strategies and icons.
    Free
    Add to Wishlist
    Download
    AI Customize
    Five colorful gears with a central red, surrounding purple, yellow, green, and blue arranged in a circular pattern.
    Add to Wishlist
    Download
    AI Customize
    Infographic illustrating the creative process with five colorful steps Research, Idea, Process, Time, and Goal with text.
    Add to Wishlist
    Download
    AI Customize
    Slide illustrating a marketing strategy with four color coded steps and corresponding icons for clarity.
    Free
    Add to Wishlist
    Download
    AI Customize
    Four blue circles with square panels connected by gray dots, each with icons and captions on a white background.
    Free
    Add to Wishlist
    Download
    AI Customize
    Linear process diagram with three gold hexagons, arrows, and captions areas on a dark green background.
    Add to Wishlist
    Download
    AI Customize
    Nine-step horizontal project timeline with numbered circles and alternating captions for each stage.
    Add to Wishlist
    Download
    AI Customize
    Circular arrow process diagram slide with six colorful steps, each labeled with a number and caption.
    Add to Wishlist
    Download
    AI Customize
    A pack of process slides showcasing five steps from business to profit, with colorful icons and text.
    Free
    Add to Wishlist
    Download
    AI Customize
    Three circles in purple, green, and pink, labeled A, B, C connected by colorful wave like ribbons, on a white background.
    Free
    Add to Wishlist
    Download
    AI Customize
    Curved blue path with four rounded segments, each containing an icon and caption area, on a white background.
    Add to Wishlist
    Download
    AI Customize
    Collection of process costing infographics slides featuring colorful charts, step by step flows, and data visuals with icons.