Editable Pie Chart PowerPoint and Google Slides Themes

A 3D pie chart with sections labeled 60%, 30%, 15%, and 10%, paired with captions for four steps.
P.ID : 11667
    302 views
    5 Downloads
    Get Custom Slides by Experts
    Instantly Access Templates in PowerPoint

    Pie Chart PowerPoint and Google Slides Themes


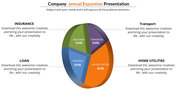
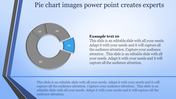
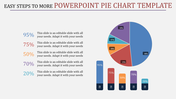
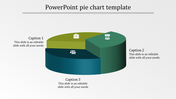
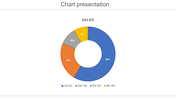
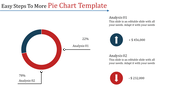
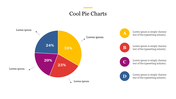
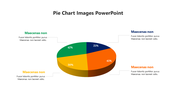
    In our Pie Chart PowerPoint and Google Slides template, a dark pie chart takes center stage, adorned with various color shades, each representing distinct data categories. Beneath the chart, colors are clearly labeled alongside logos and text, enhancing visual comprehension. The white background provides optimal contrast, ensuring data clarity and focus.


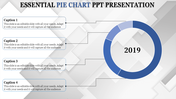
    Perfect for data analysis presentations, financial reports, or statistical discussions, this template offers a visually engaging platform to showcase information effectively. Its simplicity and clarity facilitate audience understanding while maintaining a professional aesthetic.


    Easily customizable, users can adjust colors, logos, and text to align with branding or presentation themes seamlessly. By leveraging this template, presenters can convey complex data in a visually compelling manner, fostering audience engagement and comprehension.


    Empower your presentations with our Pie Chart PowerPoint and Google Slides template. Elevate your data visualization and captivate your audience with clear, impactful charts. Why wait? Grab it now!


    Features of the template

    • 100% customizable slides and easy to download.
    • Slides are available in different nodes & colors.
    • The slide contains 16:9 and 4:3 formats.
    • It is easy to change the colors of the slide quickly. 
    • Well-crafted template with an instant download facility.

    Advertisement

    You May Also Like These PowerPoint Templates

    Add to Wishlist
    Download
    AI Customize
    A donut chart with four sections in green, red, and white, labeled with percentages, and text boxes around it.
    Add to Wishlist
    Download
    AI Customize
    Color coded diagram illustrating viva networking with five categories in blue and green tones, arranged in a circular layout.
    Free
    Add to Wishlist
    Download
    AI Customize
    Annual colorful pie chart slide showing a breakdown of a company’s yearly expansion by categories on a blue theme.
    Free
    Add to Wishlist
    Download
    AI Customize
    Chart template with a central circle and four speech bubbles with each holdoing a placeholder text areas.
    Add to Wishlist
    Download
    AI Customize
    Progress chart slide showing four colorful circular charts labeled from business to report with varying percentages and text.
    Free
    Add to Wishlist
    Download
    AI Customize
    Multi-color pie chart slide deck showing data segments in various shades, each section labelled for visual comparison.
    Add to Wishlist
    Download
    AI Customize
    A color-coded pie chart illustrating four data segments with values 15%, 20%, 30%, and 35%, paired with text captions.
    Add to Wishlist
    Download
    AI Customize
    SmartArt pie chart showing 65% in red and 35% in green as a and b, with placeholder captions and a text box.
    Add to Wishlist
    Download
    AI Customize
    Three segment pie chart in shades of red and orange with percentages, aligned next to three captions on the right.
    Add to Wishlist
    Download
    AI Customize
    Colorful pie chart slide showing five distinct stages with varying percentage values each with numbered placeholder text.
    Free
    Add to Wishlist
    Download
    AI Customize
    Pie Chart Template Free Download PPT And Google Slides
    Free
    Add to Wishlist
    Download
    AI Customize
    A pie chart slide is divided into five colorful sections and icons, each with a number and connected to descriptive captions.
    Free
    Add to Wishlist
    Download
    AI Customize
    Smart pie chart with five segments in different colors, displaying percentages, with three placeholder text to the right.
    Add to Wishlist
    Download
    AI Customize
    A dynamic slide layout featuring a circular pie chart, with labeled segments and placeholder text.
    Add to Wishlist
    Download
    AI Customize
    Colorful circle chart depicting percentage distribution across four categories, with accompanying captions for each segment.
    Free
    Add to Wishlist
    Download
    AI Customize
    Four circular progress graphs in blue, orange, red, and green, each showing percentages and captions.
    Free
    Add to Wishlist
    Download
    AI Customize
    Pie chart illustration showcasing five data segments in varying colors with percentage labels and connected captions areas.