Example Of Pestle Analysis Template PPT Download
Nodes

Colors





Example Of Pestle Analysis Template PPT Download
Create analysis presentations with this Pestle Analysis PPT. This is a well-built template with a professional touch. This pre-designed template makes your presentation-making task a hassle-free one. This is a 100% user-friendly template with versatile features.
About the template:
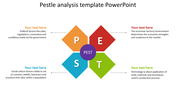
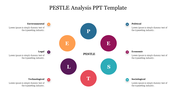
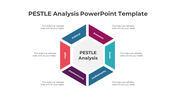
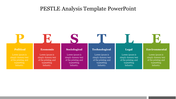
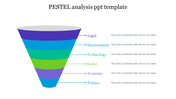
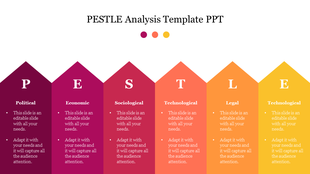
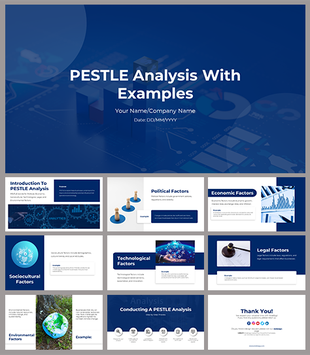
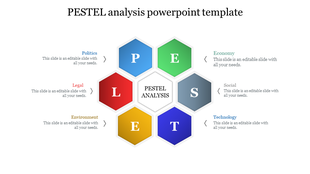
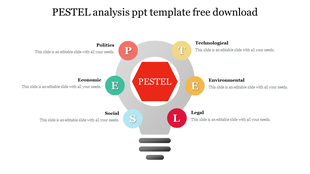
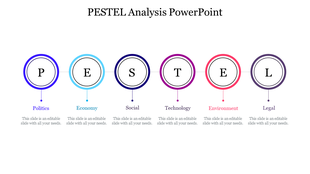
This Pestle Analysis PPT is one of the perfect PESTEL analysis PPT templates from SlideEgg. PESTLE is a word that stands for Political, Economic, Social, Technological, Legal, and Environmental factors. PESTLE analysis is a tool employed to achieve a macro picture of an industry environment.
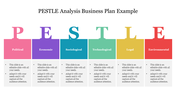
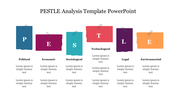
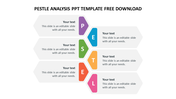
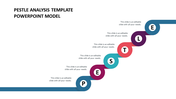
This is a six nodded template. The nodes are vertically arranged at the center of this template. Each node is represented by vibrant rectangle shape bars lettered as P, E, S, T, E, and L.
Use this vibrant PESTEL analysis template to let your audience understand your information at their first glance. Grab now!!!
Features of the template:
- 100% customizable slides and easy to download.
- Slides available in different nodes & colors.
- The slide contained 16:9 and 4:3 format.
- Easy to change the slide colors quickly.
- Well-crafted template with instant download facility.
- Stunning six-node featured template.
- Premium template with vibrant outlook.
More Collections for Example Of Pestle Analysis Template PPT Download
Recommended based on this template.
Similar Templates to Example Of Pestle Analysis Template PPT Download


Showing20 of69,218 templates