Best Market Segmentation Plan Sample PPT Presentation

Market segmentation plan sample PPT slide with a circular diagram divided into colorful sections, each labeled with text.
P.ID : 50106
    162 views
    11 Downloads
    Get Custom Slides by Experts
    Instantly Access Templates in PowerPoint

    Six Noded Market Segmentation Plan PPT Slide 

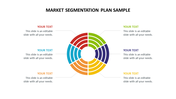
    Download this creative Market Segmentation Plan Sample PowerPoint Template from SlideEgg to make an excellent market segmentation presentation. It will help you present your organizational strategies. With this slide, your audience can easily understand the concept you are presenting. It is also 100% editable according to your needs.

    About the template:

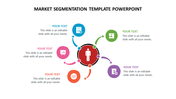
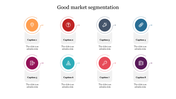
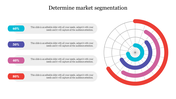
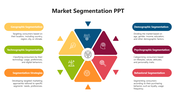
    The Market Segmentation Plan Sample PowerPoint Template has colorful concentric circles with six segments. It has attractive colors to make your slide eye-catching. Each segment includes a text block to present your information. The white background boosts the colorful infographics. Find more business PowerPoint templates from SlideEgg!

    Features of this template:

    1. 100% customizable slides and easy to download.
    2. Slides available in different nodes & colors.
    3. The slide contained 16:9 and 4:3 formats.
    4. Easy to change the slide colors quickly.
    5. Well-crafted template with instant download facility.
    6. It is colorful presentation slide.
    Advertisement

    You May Also Like These PowerPoint Templates

    Add to Wishlist
    Download
    AI Customize
    A business market segmentation slide featuring five key segmentation factors in color coded boxes with icons and text.
    Add to Wishlist
    Download
    AI Customize
    Infographic displaying four market segmentation slide deck categories arranged in blue gradient boxes with percentages.
    Add to Wishlist
    Download
    AI Customize
    A slide showing three market segmentation methods in a colorful triangular design, with icons representing each method.
    Add to Wishlist
    Download
    AI Customize
    Stacked layers in five colors, each connected to text boxes and icons representing different segments in market segmentation.
    Add to Wishlist
    Download
    AI Customize
    A visually appealing market segmentation PowerPoint slide showcasing a light bulb graphic, divided into colorful sections.
    Free
    Add to Wishlist
    Download
    AI Customize
    Amazing Market Segmentation Examples PPT And Google Slides
    Free
    Add to Wishlist
    Download
    AI Customize
    Market segmentation template with two sections, each featuring a row of figures representing in various colors.
    Add to Wishlist
    Download
    AI Customize
    Four circular progress charts in blue, purple, orange, and pink, each showing a percentage with dotted progress indicators.
    Add to Wishlist
    Download
    AI Customize
    Stunning Market Segmentation PowerPoint Template Design
    Add to Wishlist
    Download
    AI Customize
    PowerPoint template for market segmentation featuring a colorful hexagonal diagram with placeholders for text and icons.
    Add to Wishlist
    Download
    AI Customize
    Circular segmented chart with blue, yellow, red, and green arcs, each aligned with corresponding percentage labels.
    Add to Wishlist
    Download
    AI Customize
    PowerPoint slide featuring three segmented colorful circles with markers for market segmentation, each with placeholder text.
    Free
    Add to Wishlist
    Download
    AI Customize
    PowerPoint slide with a bar chart showing market segmentation with percentage labels, color coded for different ranges.
    Add to Wishlist
    Download
    AI Customize
    PowerPoint slide showcasing market segmentation with percentage circles for different data points with placeholder text.
    Free
    Add to Wishlist
    Download
    AI Customize
    Four horizontal progress bars in maroon, blue, purple, and yellow, each linked to a transport icon and numbered circles.
    Add to Wishlist
    Download
    AI Customize
    A colorful market segmentation slide featuring circular graphs displaying percentages for different segments with icons.