MILESTONE 🌟 5 Million+ creative minds trust SlideEgg! Grab 80% OFF

Dynamic Infographic PPT Presentation for Data Visualization

Infographic slide with blue layered shapes numbered 01 to 04 for a presentation template.
P.ID : 22019
    136 views
    1 Downloads
    Get Custom Slides by Experts
    Instantly Access Templates in PowerPoint

    Visualize Data Effectively with Dynamic Infographic PPT Solutions


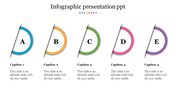
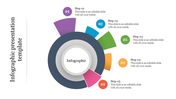
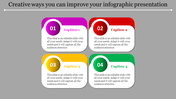
    Understanding complex information is made easy with infographics. Our Infographic Presentation Template and Google Slides Themes are for professionals, educators, and analysts seeking to convey data effectively. The template showcases a blue-themed square box divided into four sections, each containing a caption and a text area, against a vibrant multicolor backdrop.

    Ideal for data analysis presentations, research reports, and educational seminars, these slides help transform data into engaging visuals. The intuitive design and structured layout ensure that your audience grasps key insights quickly.

    Maximize the impact of your presentations with our Infographic Presentation Template and Google Slides Themes. Download now to create polished, professional slideshows that captivate your audience and communicate your message.

    Features of the template


    • 100% customizable slides are easy to download.
    • Slides are available in different colors.
    • The slide has 4:3 and 16:9 formats.
    • It is easy to change the slide colors quickly.
    • It has a cute design to impress an audience.
    • Create feature-rich, animated presentations.
    Advertisement

    You May Also Like These PowerPoint Templates

    Free
    Add to Wishlist
    Download
    AI Customize
    Infographic PPT template with four caption sections each represented by a colorful leaf.
    Add to Wishlist
    Download
    AI Customize
    Octagonal infographic in green with eight surrounding sections labeled A to H, each containing placeholder text areas.
    Free
    Add to Wishlist
    Download
    AI Customize
    Infographic slide featuring blue sheep, yellow pig, and orange cow silhouettes with corresponding captions.
    Free
    Add to Wishlist
    Download
    AI Customize
    Road sign infographic with four orange signs placed alternately on a pole, each containing white text.
    Add to Wishlist
    Download
    AI Customize
    PowerPoint slide on financial analysis with icons and descriptions from data examination to informed decisions.
    Add to Wishlist
    Download
    AI Customize
    Infografias Para PowerPoint colorful circular infographic slide with eight numbered segments with captions.
    Free
    Add to Wishlist
    Download
    AI Customize
    PowerPoint slide with a circular blue swirl diagram featuring six icons and text placeholders on a white backdrop.
    Free
    Add to Wishlist
    Download
    AI Customize
    Creative PPT slide with a circular infographic and a lightbulb shaped design, featuring purple icons and text placeholders.
    Free
    Add to Wishlist
    Download
    AI Customize
    Attractive PPT And Google Slides Template With 4 Nodes
    Free
    Add to Wishlist
    Download
    AI Customize
    Green Color Infographics PowerPoint And Google Slides
    Free
    Add to Wishlist
    Download
    AI Customize
    Slide with four icons in rounded purple boxes, numbered 1 to 4, connected by curved arrows.
    Add to Wishlist
    Download
    AI Customize
    Silhouette of a bull divided into two sections in yellow and red, with percentages, placed above grass, with captions.
    Add to Wishlist
    Download
    AI Customize
    Infographic with a curved line linking five colorful speech boxes in purple, orange, green, blue, and red connected by dots.
    Free
    Add to Wishlist
    Download
    AI Customize
    Four step infographic with yellow arrow shapes, each containing circular icons and descriptive captions.
    Free
    Add to Wishlist
    Download
    AI Customize
    Versatile Infographic PowerPoint Template for Presentations
    Add to Wishlist
    Download
    AI Customize
    Infographic slide featuring three sections from Market Analysis to Go to Market Strategy with numbers 1 to 3.