Iceberg Chart Maker PowerPoint and Google Slides Themes

Iceberg Chart Maker Presentation Slides
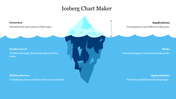
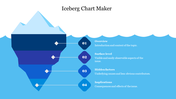
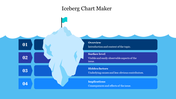
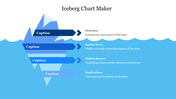
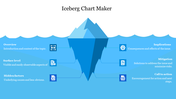
An iceberg chart is a type of chart that displays the distribution of data. The top part of the iceberg represents the visible or known information, while the bottom part represents the hidden or unknown information. This type of chart is often used in risk management or project planning, where the hidden risks or issues are just as important as the visible ones. By using an iceberg chart, one can clearly show the full picture of a situation and make informed decisions. You can use it to identify the underlying issues and their root causes, understand complex situations, and communicate them effectively. This template can help you in presentations, reports, and project management.
Features of the templates:
- 100% customizable slides and easy to download.
- Slides available in different nodes & colors.
- The slide contained 16:9 and 4:3 format.
- Easy to change the slide colors quickly.
- Well-crafted template with instant download facility.
- Pre-built template with cost-efficient access.
- Professionally designed template with serene outlook.


You May Also Like These PowerPoint Templates
Add to Wishlist
Download
AI Customize

Add to Wishlist
Download
AI Customize

Free
Add to Wishlist
Download
AI Customize

Add to Wishlist
Download
AI Customize

Add to Wishlist
Download
AI Customize

Add to Wishlist
Download
AI Customize

Add to Wishlist
Download
AI Customize

Add to Wishlist
Download
AI Customize

Add to Wishlist
Download
AI Customize

Add to Wishlist
Download
AI Customize

Add to Wishlist
Download
AI Customize

Add to Wishlist
Download
AI Customize

Add to Wishlist
Download
AI Customize

Add to Wishlist
Download
AI Customize


Add to Wishlist
Download
AI Customize

Add to Wishlist
Download
AI Customize

Add to Wishlist
Download
AI Customize

Free
Add to Wishlist
Download
AI Customize

Add to Wishlist
Download
AI Customize

Add to Wishlist
Download
AI Customize

Add to Wishlist
Download
AI Customize


Add to Wishlist
Download
AI Customize

Add to Wishlist
Download
AI Customize

Add to Wishlist
Download
AI Customize

Add to Wishlist
Download
AI Customize


Add to Wishlist
Download
AI Customize

Add to Wishlist
Download
AI Customize

Add to Wishlist
Download
AI Customize


Add to Wishlist
Download
AI Customize

Add to Wishlist
Download
AI Customize

Add to Wishlist
Download
AI Customize

Add to Wishlist
Download
AI Customize
