Eye-Catching Colorful Heat Map PowerPoint Template

 Canva
Canva
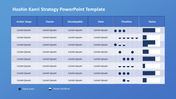
Attractive Multicolor Data Representation Chart Slide
A Heat Map Chart is a specialized 2D visual representation of data, which uses multiple colors to represent the values. It will help you show the complex and large data. Our heat map PowerPoint template can help you make an excellent presentation that will convey your data more professionally. It has an eye-catching, colorful table with six rows. It has enough text blocks to hold your notes and an indicator to define the colors and their scores. It is an entirely editable slide, which allows you to edit the chart with your own data.
Features of the template
- 100% customizable slides and easy to download.
- Slides are available in different nodes & colors.
- The slide contained 16:9 and 4:3 formats.
- Easy to change the slide colors quickly.
- Well-crafted template with instant download facility.
- It has attractive colors.


You May Also Like These PowerPoint Templates
Add to Wishlist
Download
Edit

Add to Wishlist
Download
Edit

Add to Wishlist
Download
Edit

Add to Wishlist
Download
Edit

Add to Wishlist
Download
Edit

Add to Wishlist
Download
Edit


Add to Wishlist
Download
Edit

Add to Wishlist
Download
Edit

Add to Wishlist
Download
Edit

Add to Wishlist
Download
Edit

Add to Wishlist
Download
Edit

Add to Wishlist
Download
Edit

Add to Wishlist
Download
Edit

Add to Wishlist
Download
Edit


Add to Wishlist
Download
Edit

Add to Wishlist
Download
Edit

Add to Wishlist
Download
Edit

Add to Wishlist
Download
Edit
