Innovative Feature Gap Analysis PowerPoint And Google Slides
Nodes

Colors
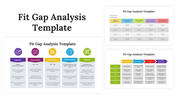
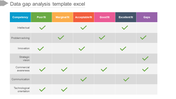
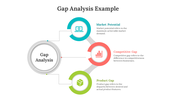
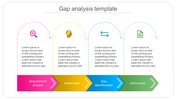

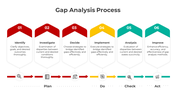
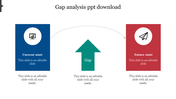
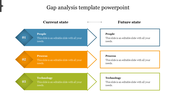
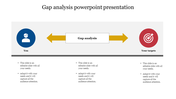
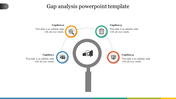
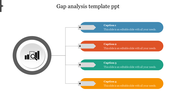
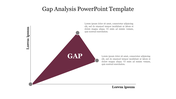
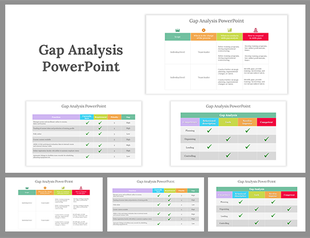
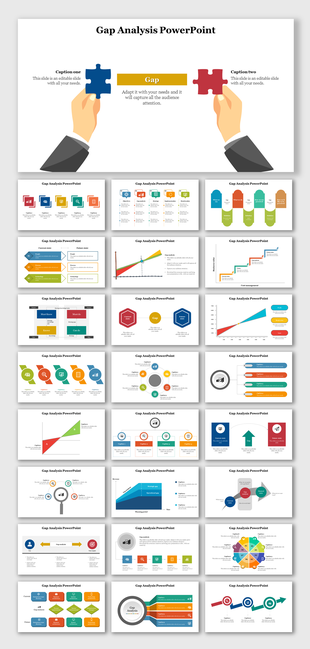
Effective Feature Gap Analysis Graph PowerPoint Template
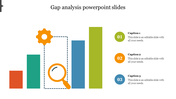
A Feature Gap Analysis PowerPoint slide shows the relations among variables measured over time and within a particular data set. This template will help you to explain important information about Gap Analysis. The graph and chart on the slide will help the audience to get an idea about your core content. This Feature Gap Analysis PowerPoint slide is used to compare two or more sets of information. It also has icons that help you to present important information to the audience. In addition, We also have a wide range of Gap analysis PowerPoint slides. This template is 100% editable. For example, you can change the icon colors in this PowerPoint slide.
Features of this template:
- It is a pre-built design to save time.
- Fully Customizable (shape color, size & text)
- This template has a blue theme.
- Drag and drop image placeholder
- Huge Collections of slides to impress your audience
- It supports an aspect ratio of 16:9 and 4:3 format
More Collections for Innovative Feature Gap Analysis PowerPoint
Recommended based on this template.
Similar Templates to Innovative Feature Gap Analysis PowerPoint


Showing20 of69,218 templates