Creating Infographics In PowerPoint For Data Visualization
Nodes

Colors


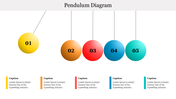

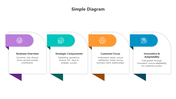


Infographic Presentation Template
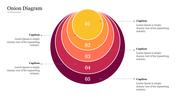
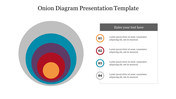
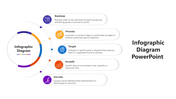
Craft an Engaging presentation with our Infographic PowerPoint Template. Featuring a captivating white star at its core, adorned with vibrant, interconnected multicolor squares, each representing a facet of your data or ideas. Embellished with sleek business icons, this template seamlessly merges creativity with professionalism, ensuring your message resonates powerfully with your audience.
Transform your presentations effortlessly! Ideal for professionals, students, or anyone aiming for impact. Simply customize, plug in content, and let visuals shine! Whether pitching, sharing research, or simplifying concepts, create stunning narratives with ease. Don't settle for static slides—captivate with dynamic infographics! Download now to unleash your presentation's full potential!
Features of the template
- 100% customizable slides and easy to download.
- Slides are available in different colors
- The slide has 4:3 and 16:9 formats.
- Easy to change the slide colors quickly.
- Appealing Presentation to impress an audience.
- Create feature-rich slide presentations.
- An eye-pleasing color slide helps to give a catchy display.
- It is apt with PPT and Google Slides.
More Collections for Creating Infographics In PowerPoint
Recommended based on this template.
Similar Templates to Creating Infographics In PowerPoint


Showing20 of69,218 templates